

Insurance brokerage firm Brown & Brown (NYSE: BRO) missed Wall Street’s revenue expectations in Q4 CY2025, but sales rose 36% year on year to $1.61 billion. Its non-GAAP profit of $0.93 per share was 3.3% above analysts’ consensus estimates.
Is now the time to buy Brown & Brown? Find out by accessing our full research report, it’s free.
Brown & Brown (BRO) Q4 CY2025 Highlights:
- Revenue: $1.61 billion vs analyst estimates of $1.64 billion (36% year-on-year growth, 2.2% miss)
- Adjusted EPS: $0.93 vs analyst estimates of $0.90 (3.3% beat)
- Adjusted EBITDA: $529 million vs analyst estimates of $522.4 million (32.9% margin, 1.3% beat)
- Free Cash Flow Margin: 26.4%, down from 28.8% in the same quarter last year
- Market Capitalization: $27.03 billion
Company Overview
With roots dating back to 1939 and operations spanning 44 U.S. states and 14 countries, Brown & Brown (NYSE: BRO) is an insurance brokerage and risk management firm that markets and sells insurance products across property, casualty, and employee benefits sectors.
Revenue Growth
A company’s long-term performance is an indicator of its overall quality. Even a bad business can shine for one or two quarters, but a top-tier one grows for years.
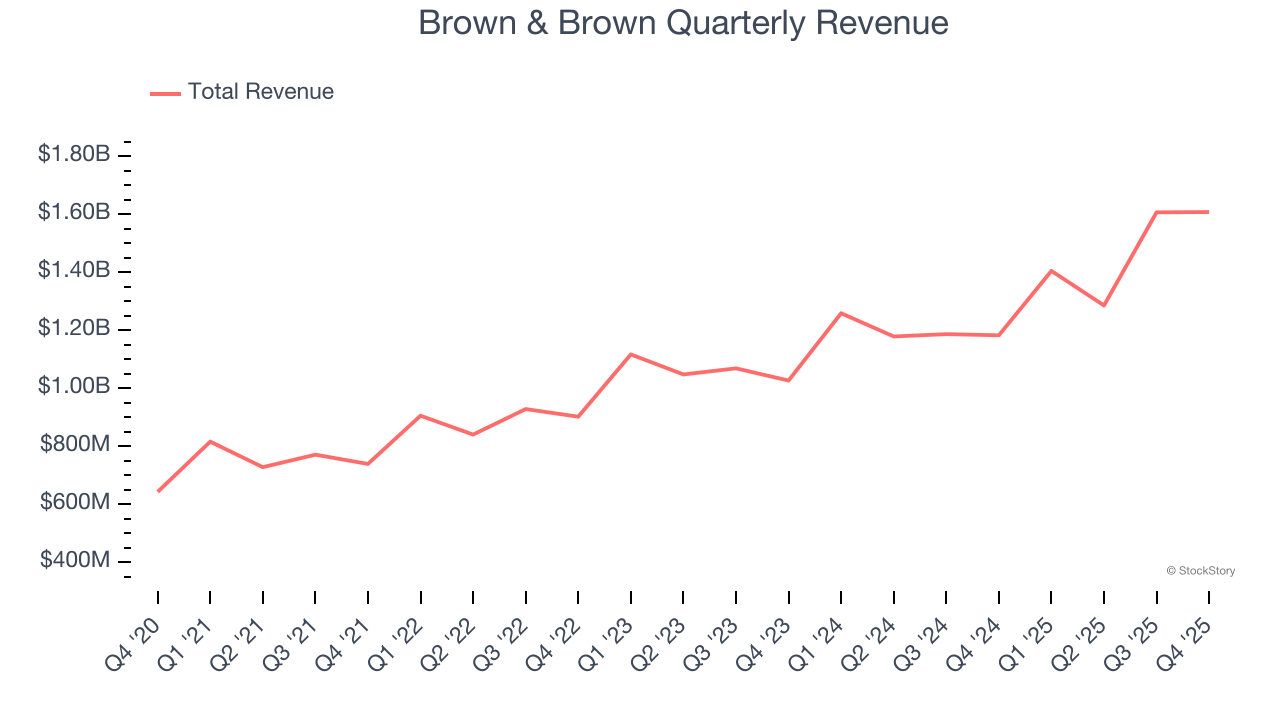
With $5.90 billion in revenue over the past 12 months, Brown & Brown is one of the larger companies in the business services industry and benefits from a well-known brand that influences purchasing decisions.
As you can see below, Brown & Brown’s sales grew at an incredible 17.7% compounded annual growth rate over the last five years. This is a great starting point for our analysis because it shows Brown & Brown’s demand was higher than many business services companies.
Long-term growth is the most important, but within business services, a half-decade historical view may miss new innovations or demand cycles. Brown & Brown’s annualized revenue growth of 17.7% over the last two years aligns with its five-year trend, suggesting its demand was predictably strong. 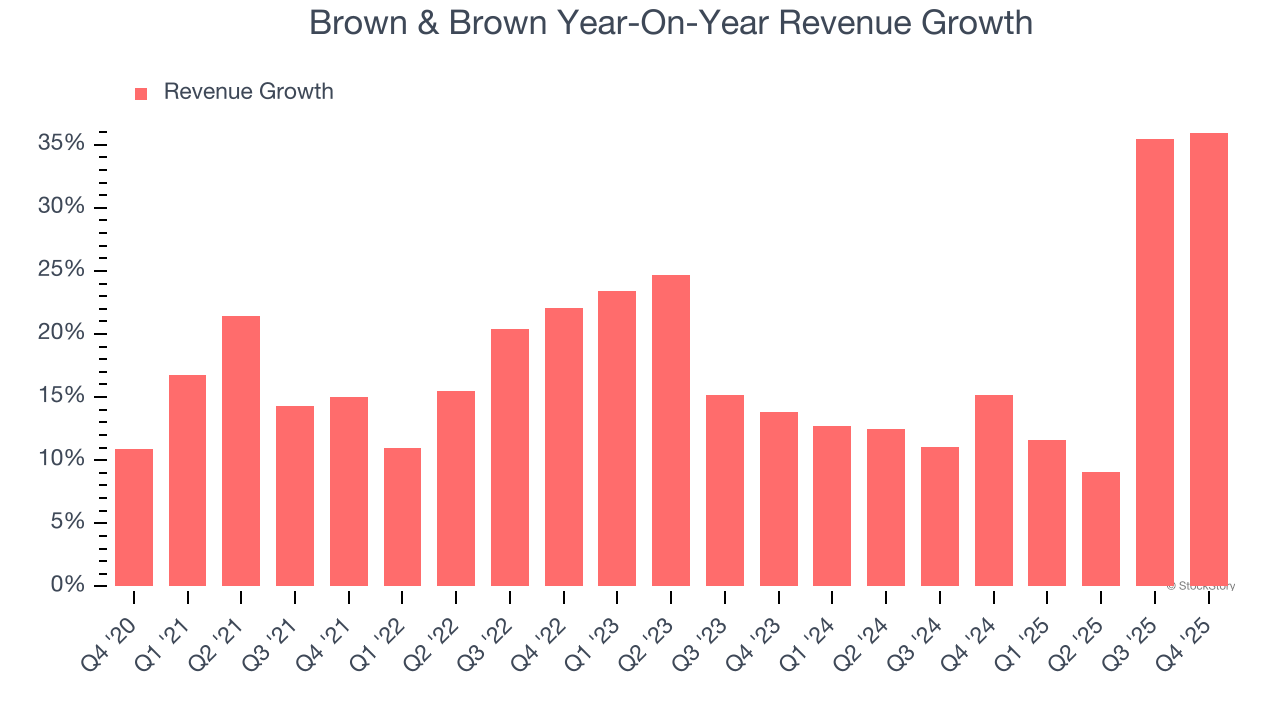
This quarter, Brown & Brown pulled off a wonderful 36% year-on-year revenue growth rate, but its $1.61 billion of revenue fell short of Wall Street’s rosy estimates.
Looking ahead, sell-side analysts expect revenue to grow 23.5% over the next 12 months, an improvement versus the last two years. This projection is eye-popping and suggests its newer products and services will catalyze better top-line performance.
The 1999 book Gorilla Game predicted Microsoft and Apple would dominate tech before it happened. Its thesis? Identify the platform winners early. Today, enterprise software companies embedding generative AI are becoming the new gorillas. a profitable, fast-growing enterprise software stock that is already riding the automation wave and looking to catch the generative AI next.
Operating Margin
Operating margin is one of the best measures of profitability because it tells us how much money a company takes home after subtracting all core expenses, like marketing and R&D.
Brown & Brown has been a well-oiled machine over the last five years. It demonstrated elite profitability for a business services business, boasting an average operating margin of 25.7%.
Looking at the trend in its profitability, Brown & Brown’s operating margin decreased by 2.5 percentage points over the last five years. This raises questions about the company’s expense base because its revenue growth should have given it leverage on its fixed costs, resulting in better economies of scale and profitability.
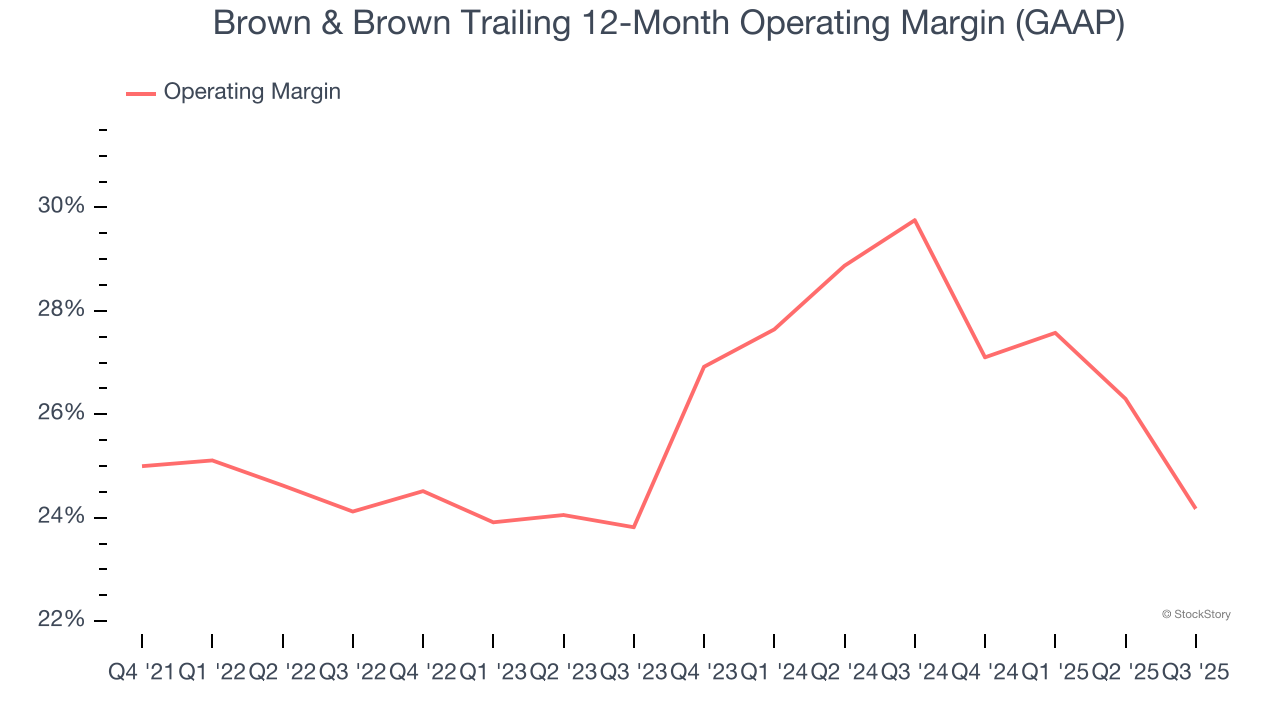
in line with the same quarter last year. This indicates the company’s overall cost structure has been relatively stable.
Earnings Per Share
We track the long-term change in earnings per share (EPS) for the same reason as long-term revenue growth. Compared to revenue, however, EPS highlights whether a company’s growth is profitable.
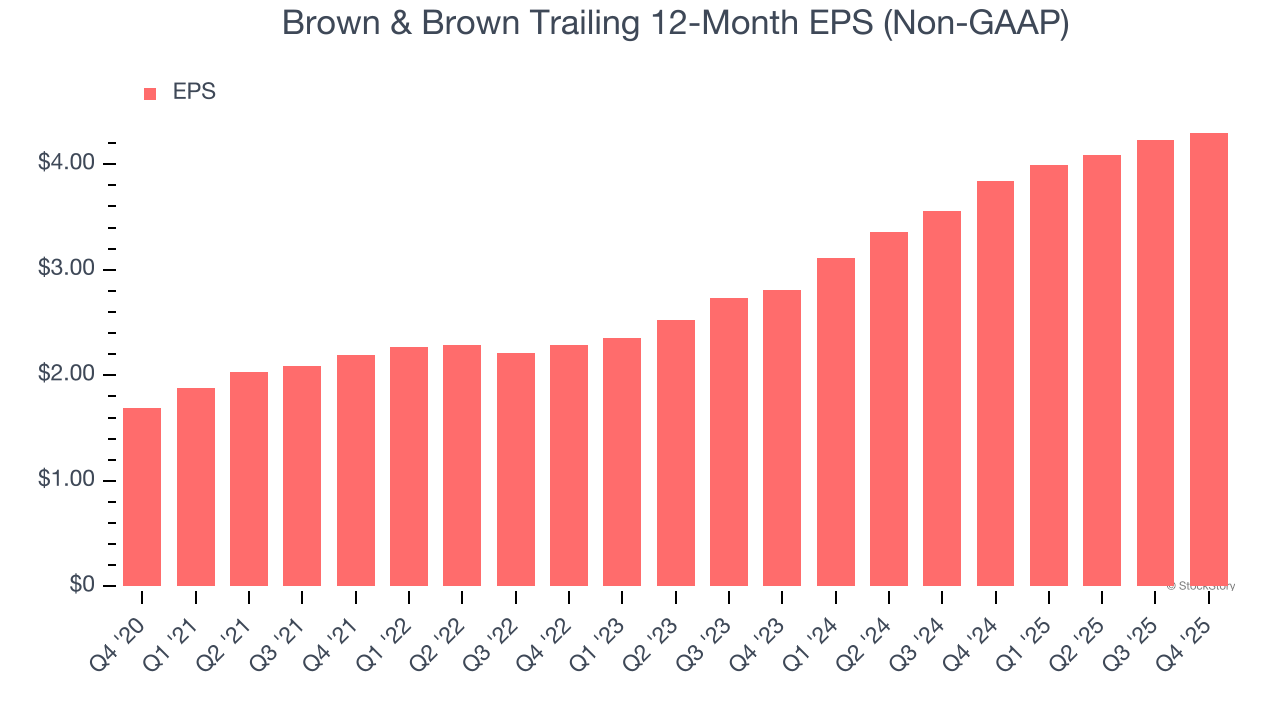
Brown & Brown’s EPS grew at an astounding 20.5% compounded annual growth rate over the last five years, higher than its 17.7% annualized revenue growth. However, we take this with a grain of salt because its operating margin didn’t improve and it didn’t repurchase its shares, meaning the delta came from reduced interest expenses or taxes.
Like with revenue, we analyze EPS over a more recent period because it can provide insight into an emerging theme or development for the business.
For Brown & Brown, its two-year annual EPS growth of 23.7% was higher than its five-year trend. We love it when earnings growth accelerates, especially when it accelerates off an already high base.
In Q4, Brown & Brown reported adjusted EPS of $0.93, up from $0.86 in the same quarter last year. This print beat analysts’ estimates by 3.3%. Over the next 12 months, Wall Street expects Brown & Brown’s full-year EPS of $4.30 to grow 7.3%.
Key Takeaways from Brown & Brown’s Q4 Results
It was good to see Brown & Brown beat analysts’ EPS expectations this quarter. On the other hand, its revenue missed. Overall, this was a softer quarter. The stock traded down 3.6% to $77.26 immediately following the results.
The latest quarter from Brown & Brown’s wasn’t that good. One earnings report doesn’t define a company’s quality, though, so let’s explore whether the stock is a buy at the current price. What happened in the latest quarter matters, but not as much as longer-term business quality and valuation, when deciding whether to invest in this stock. We cover that in our actionable full research report which you can read here (it’s free).


