
Starbucks Corporation (SBUX), amongst other establishments, has been feeling the heat as consumers demand organizations to express a stance in relation to the Israel-Hamas conflict. Boycott campaigns have particularly escalated in several Arab nations.
The coffee chain's position became a headline when the Union briefly broadcasted a statement concerning its view on the Israel-Hamas conflict. However, Starbucks CEO Laxman Narasimhan said that people protesting against the company have been "influenced by misrepresentation on social media" of what it stands for.
On the other hand, the company seems to be witnessing a decreasing customer traffic. According to data from Placer.ai., customer traffic was weaker in November, while visits during the first week following the release of the Holiday Menu were down 3.4% year-over-year, indicating lower demand for the special holiday beverages.
Furthermore, John Ivankoe, an analyst at J.P. Morgan, has recently reduced his U.S. sales predictions for Starbucks' fiscal first quarter, citing an apparent slowdown over the holiday period compared to Fall promotions.
As a result, Starbucks shares have depressingly dipped 7.4% in the past month, and this downward trend may continue considering the ongoing legal tussle with the Union. Consequently, potential investors are advised to monitor the situation and hold off on investments until demonstrable improvements manifest. Let’s discuss some of its key financial metrices to gauge its prospects.
Analyzing Starbucks Corporation's Financial Performance from 2020 to 2023
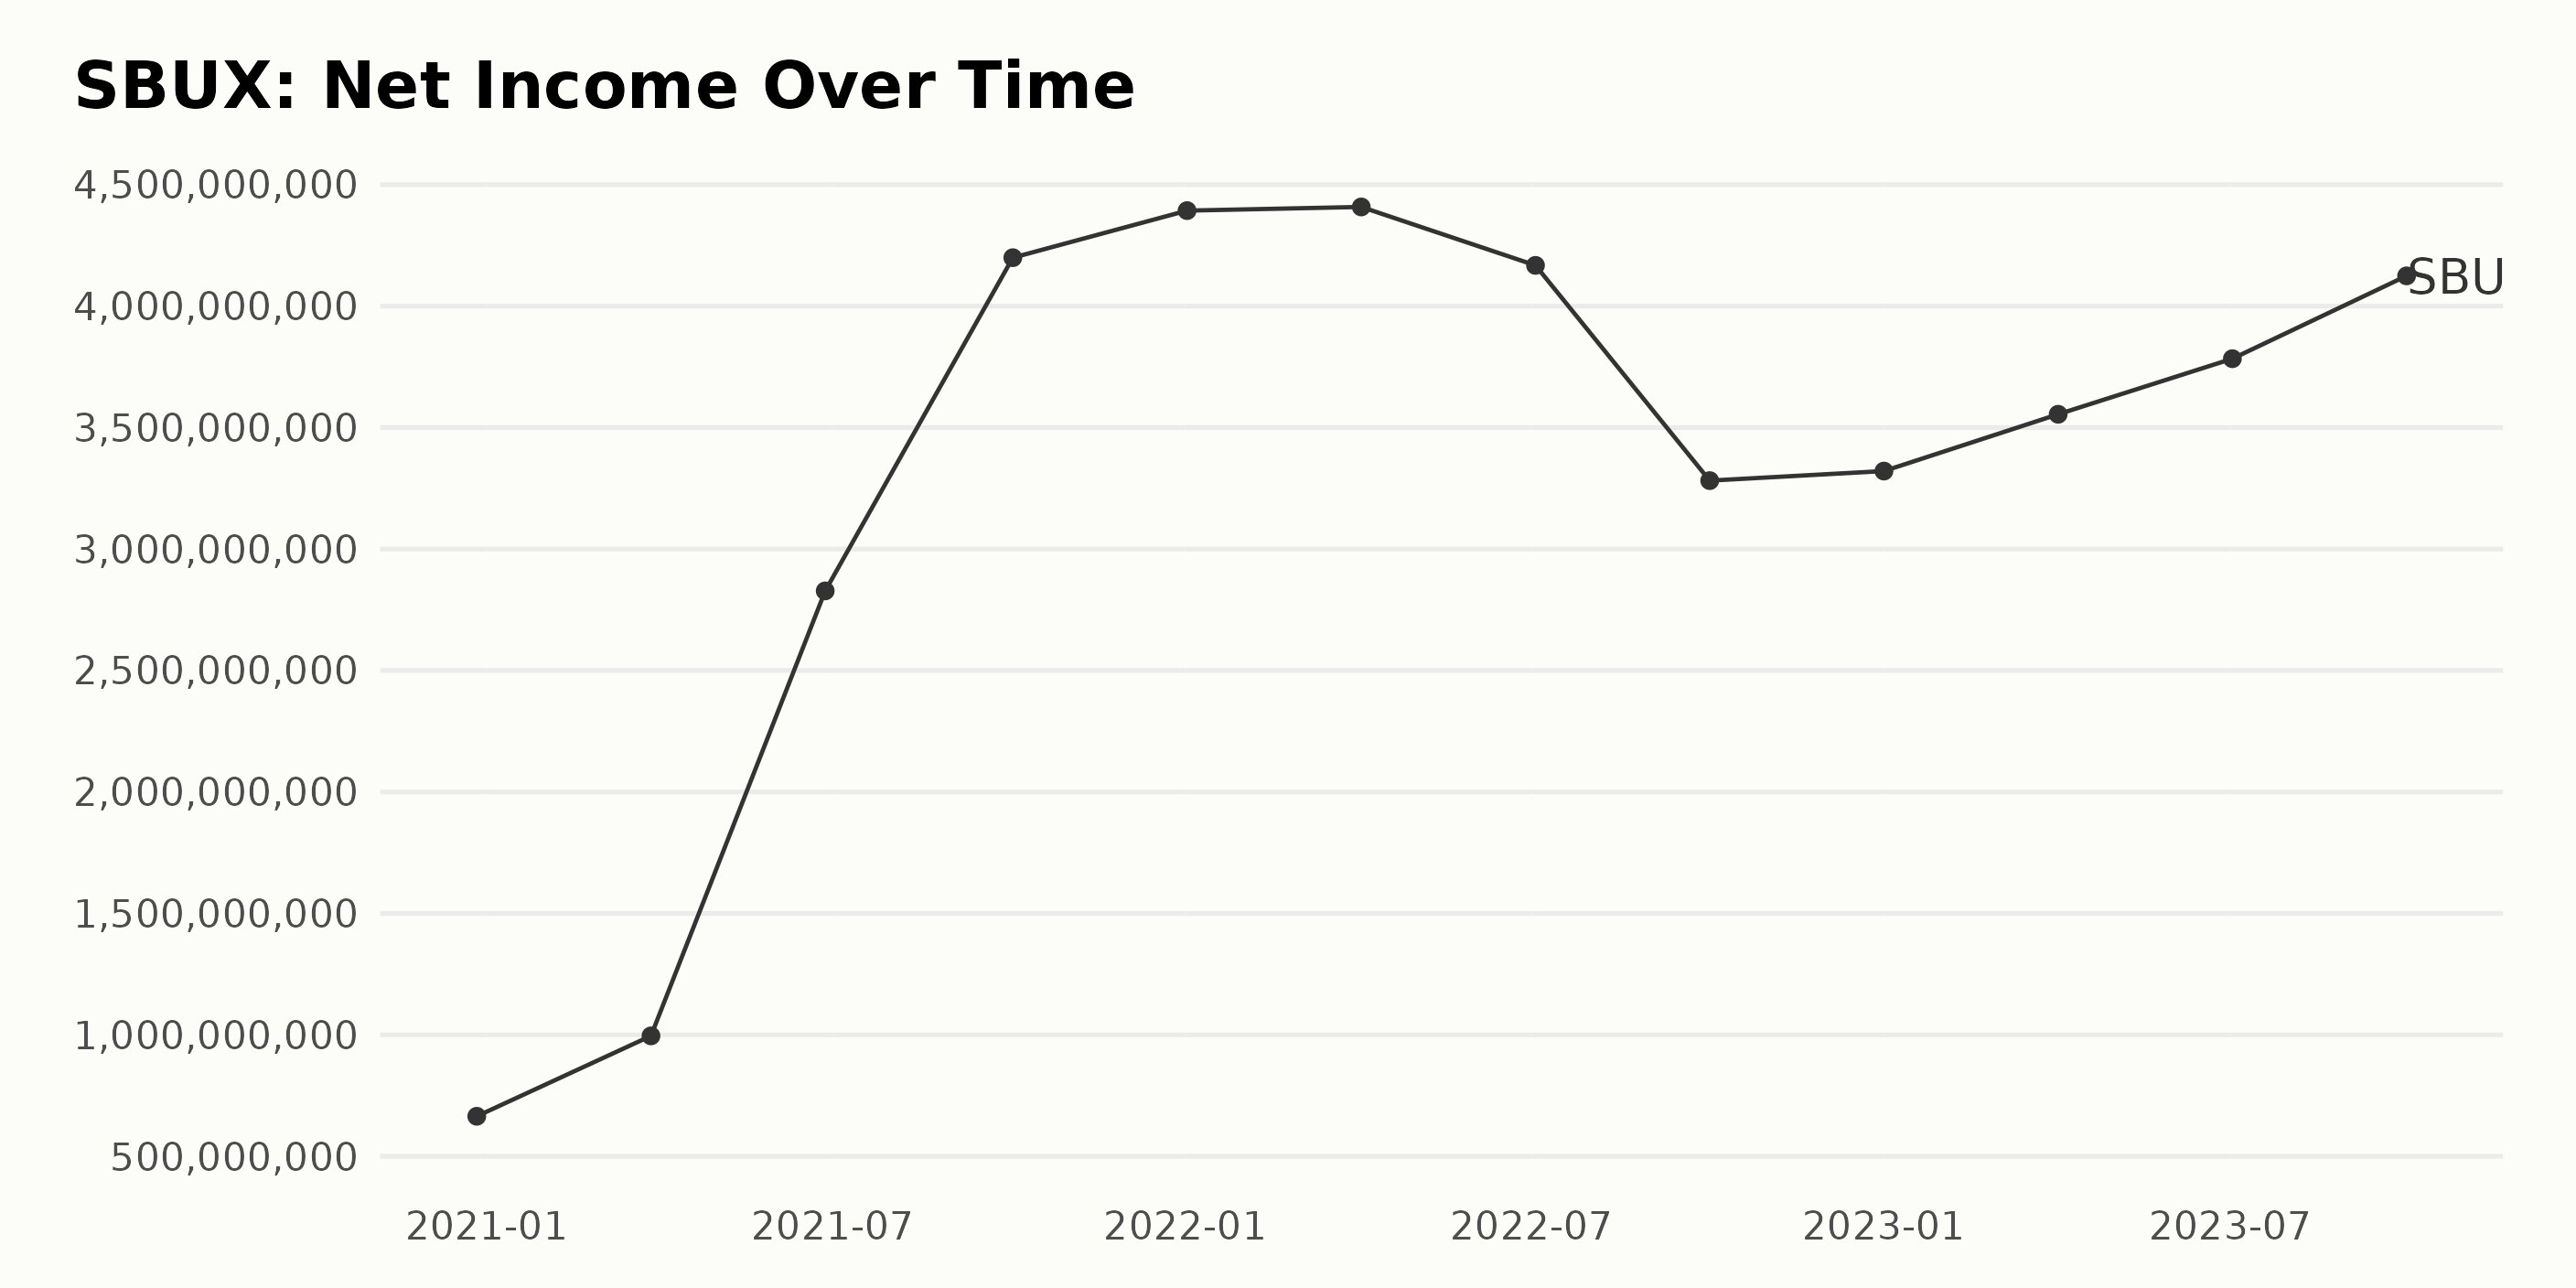
The trailing-12-month Net Income of SBUX has undertaken notable fluctuations as observed from the data provided. The significant highlights are as follows:
- The earliest data, dating back to December 27, 2020, shows a net income of $664.8 million.
- Over the year 2021, there was a substantial increase in the Net Income, which rose from $995.8 million on March 28, 2021, skyrocketed to $2.83 billion on June 27, 2021, and then again to $4.20 billion by October 3, 2021.
- The Net Income demonstrated an upsurge in the first quarter of 2022, reaching approximately $4.41 billion on April 3, 2022.
- However, the third quarter of 2022, saw a mild decrease, with net income falling to $4.17 billion on July 3, 2022, before plummeting to $3.28 billion on October 2, 2022.
- The year 2023 witnessed a relatively steady recovery after the drop in the previous year. The Net Income increased from $3.32 billion on January 1, 2023, to $3.78 billion on July 2, 2023, and touching $4.12 billion on October 1, 2023.
In terms of growth rate, there has been a substantial escalation from the initial value of $664.8 million on December 27, 2020, to the last recorded value of $4.12 billion on October 1, 2023, showing a noticeable progression in Starbucks Corporation's Net Income over the time duration. It is crucial to note that these trends and fluctuations might be influenced by various factors - seasonal changes, major business decisions, market trends, etc.
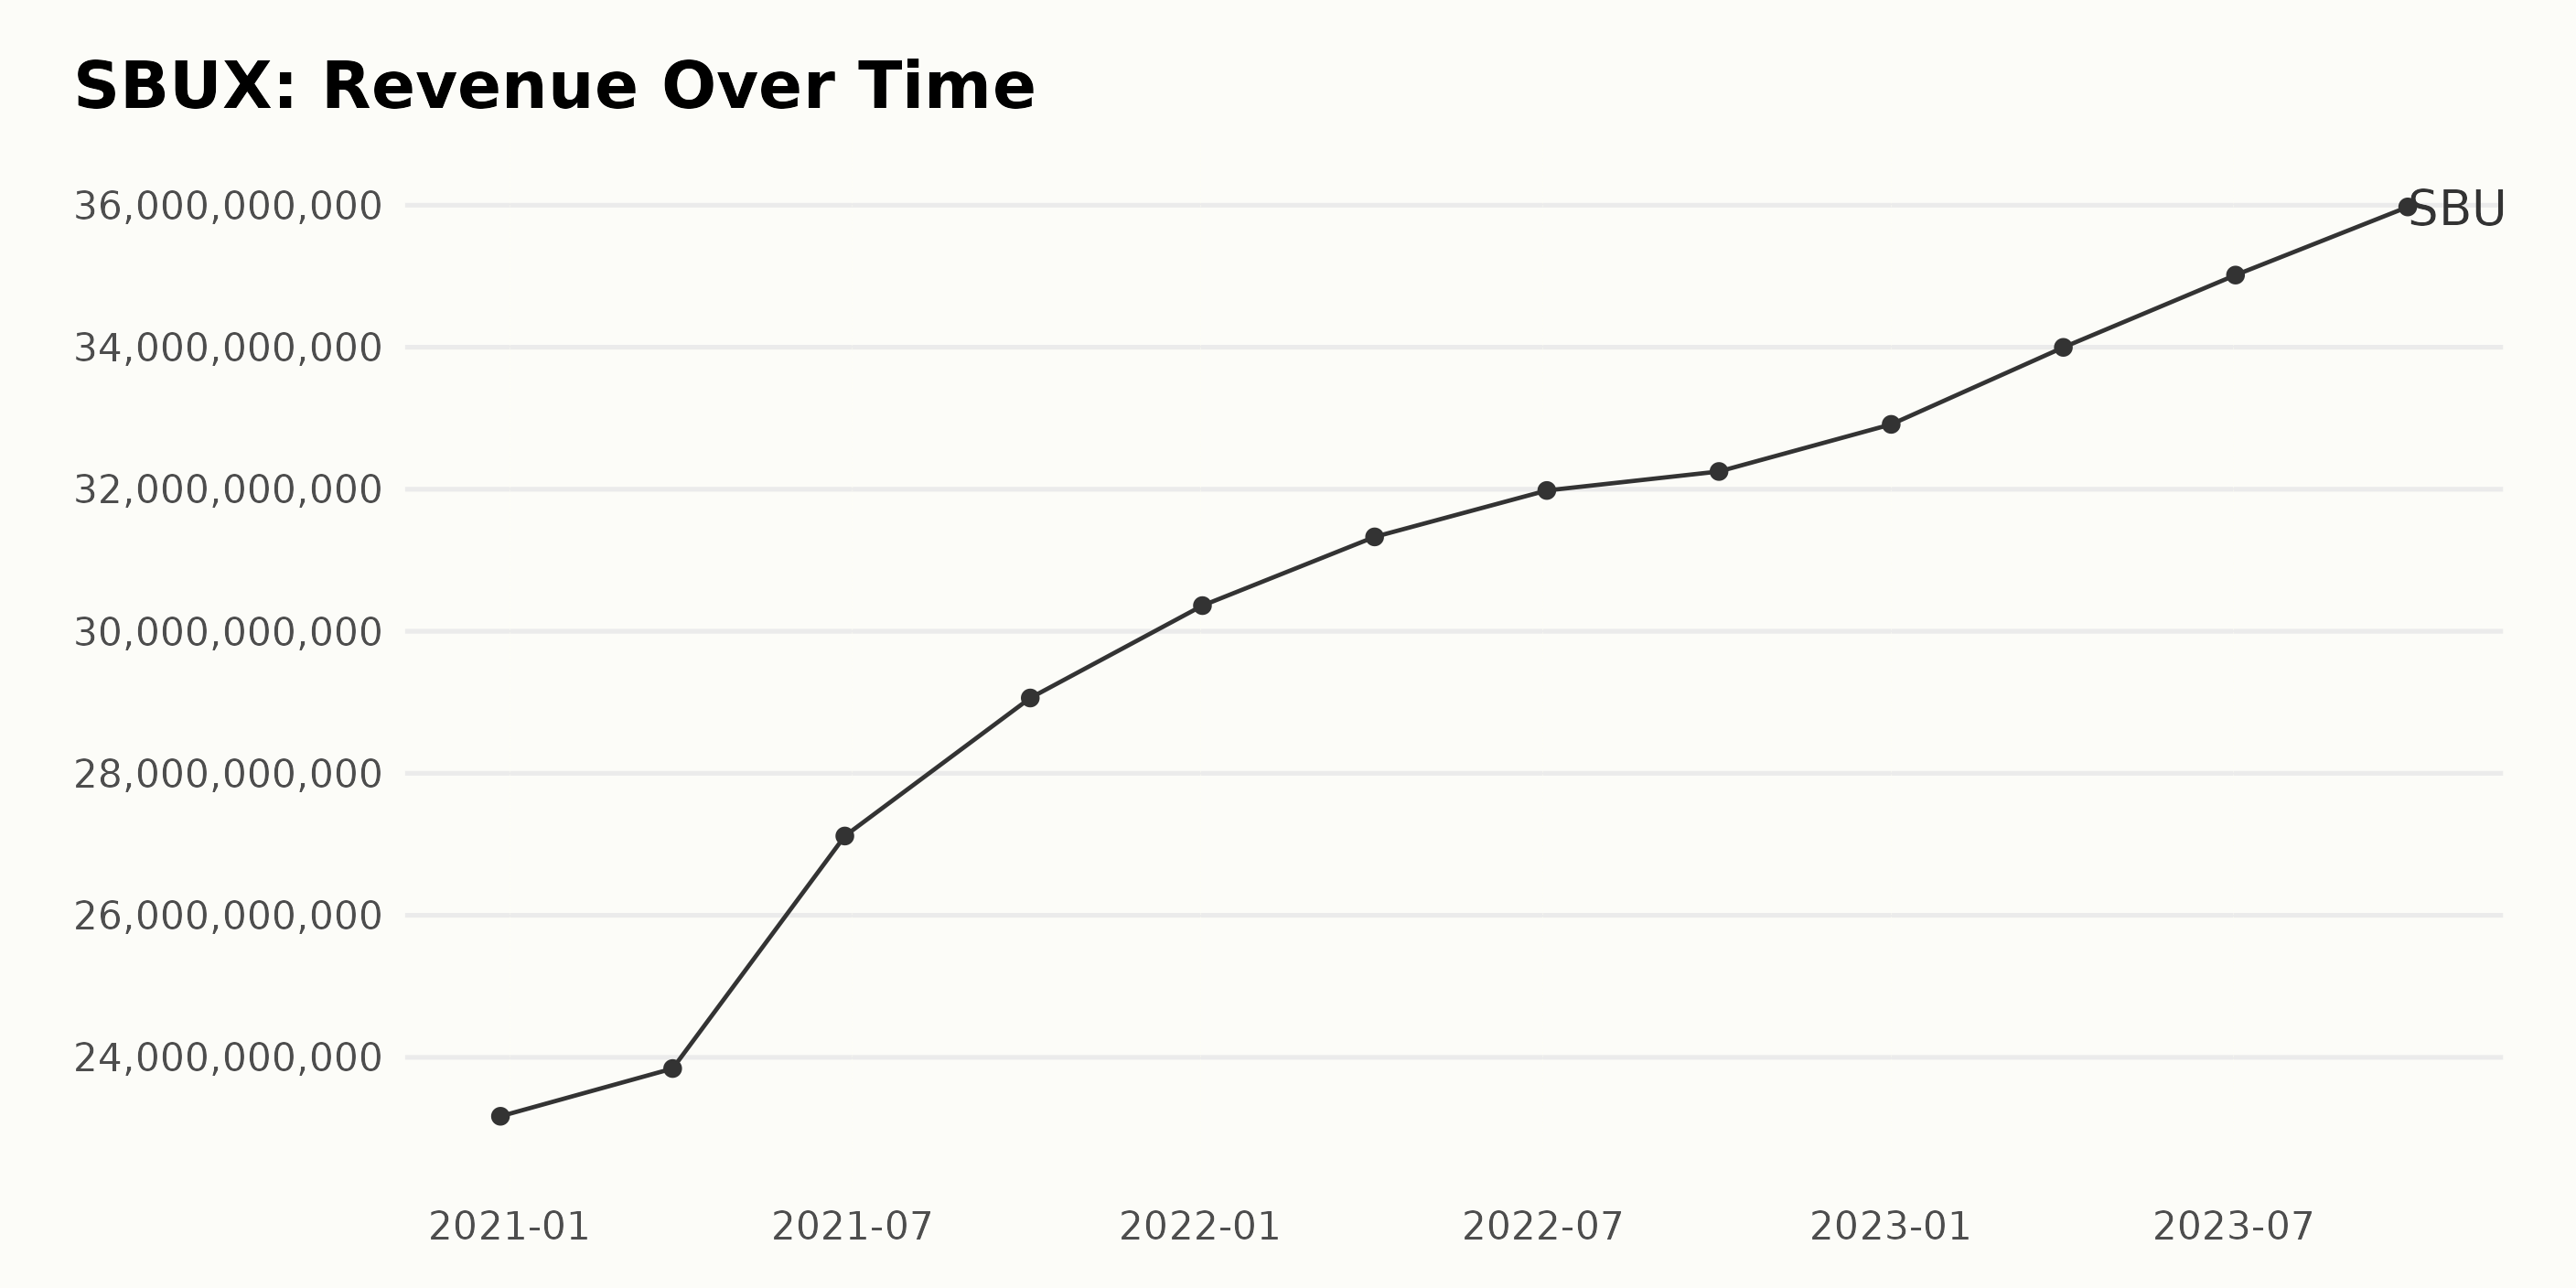
The Starbucks Corporation (SBUX)'s trailing-12-month Revenue has generally been on an upward trend from December 2020 to October 2023, with some fluctuations. The data shows steady growth. Here are the highlights of the Starbucks Corporation's revenue growth:
- In December 2020, the Revenue was at $23.17 billion.
- There was a steady rise in Revenue over the following quarters, reaching $29.06 billion in October 2021 and $32.25 billion in October 2022.
- The most rapid growth appears to have occurred between June and September 2021, where the Revenue jumped from $27.12 billion to $29.06 billion, signifying a remarkable surge within this period.
- However, the period between July and October 2022 saw a somewhat slowed growth, where the Revenue only increased from $31.93 billion to $32.25 billion.
- Towards the end of the series, from January 2023 to October 2023, the Revenue demonstrated robust growth, from $32.91 billion to $35.98 billion, indicating a strong financial period for the corporation.
The last reported value in the series is $35.98 billion as of October 2023. Comparatively, from the initial reported revenue of $23.17 billion in December 2020, this signifies a growth rate of approximately 55% over almost three years.
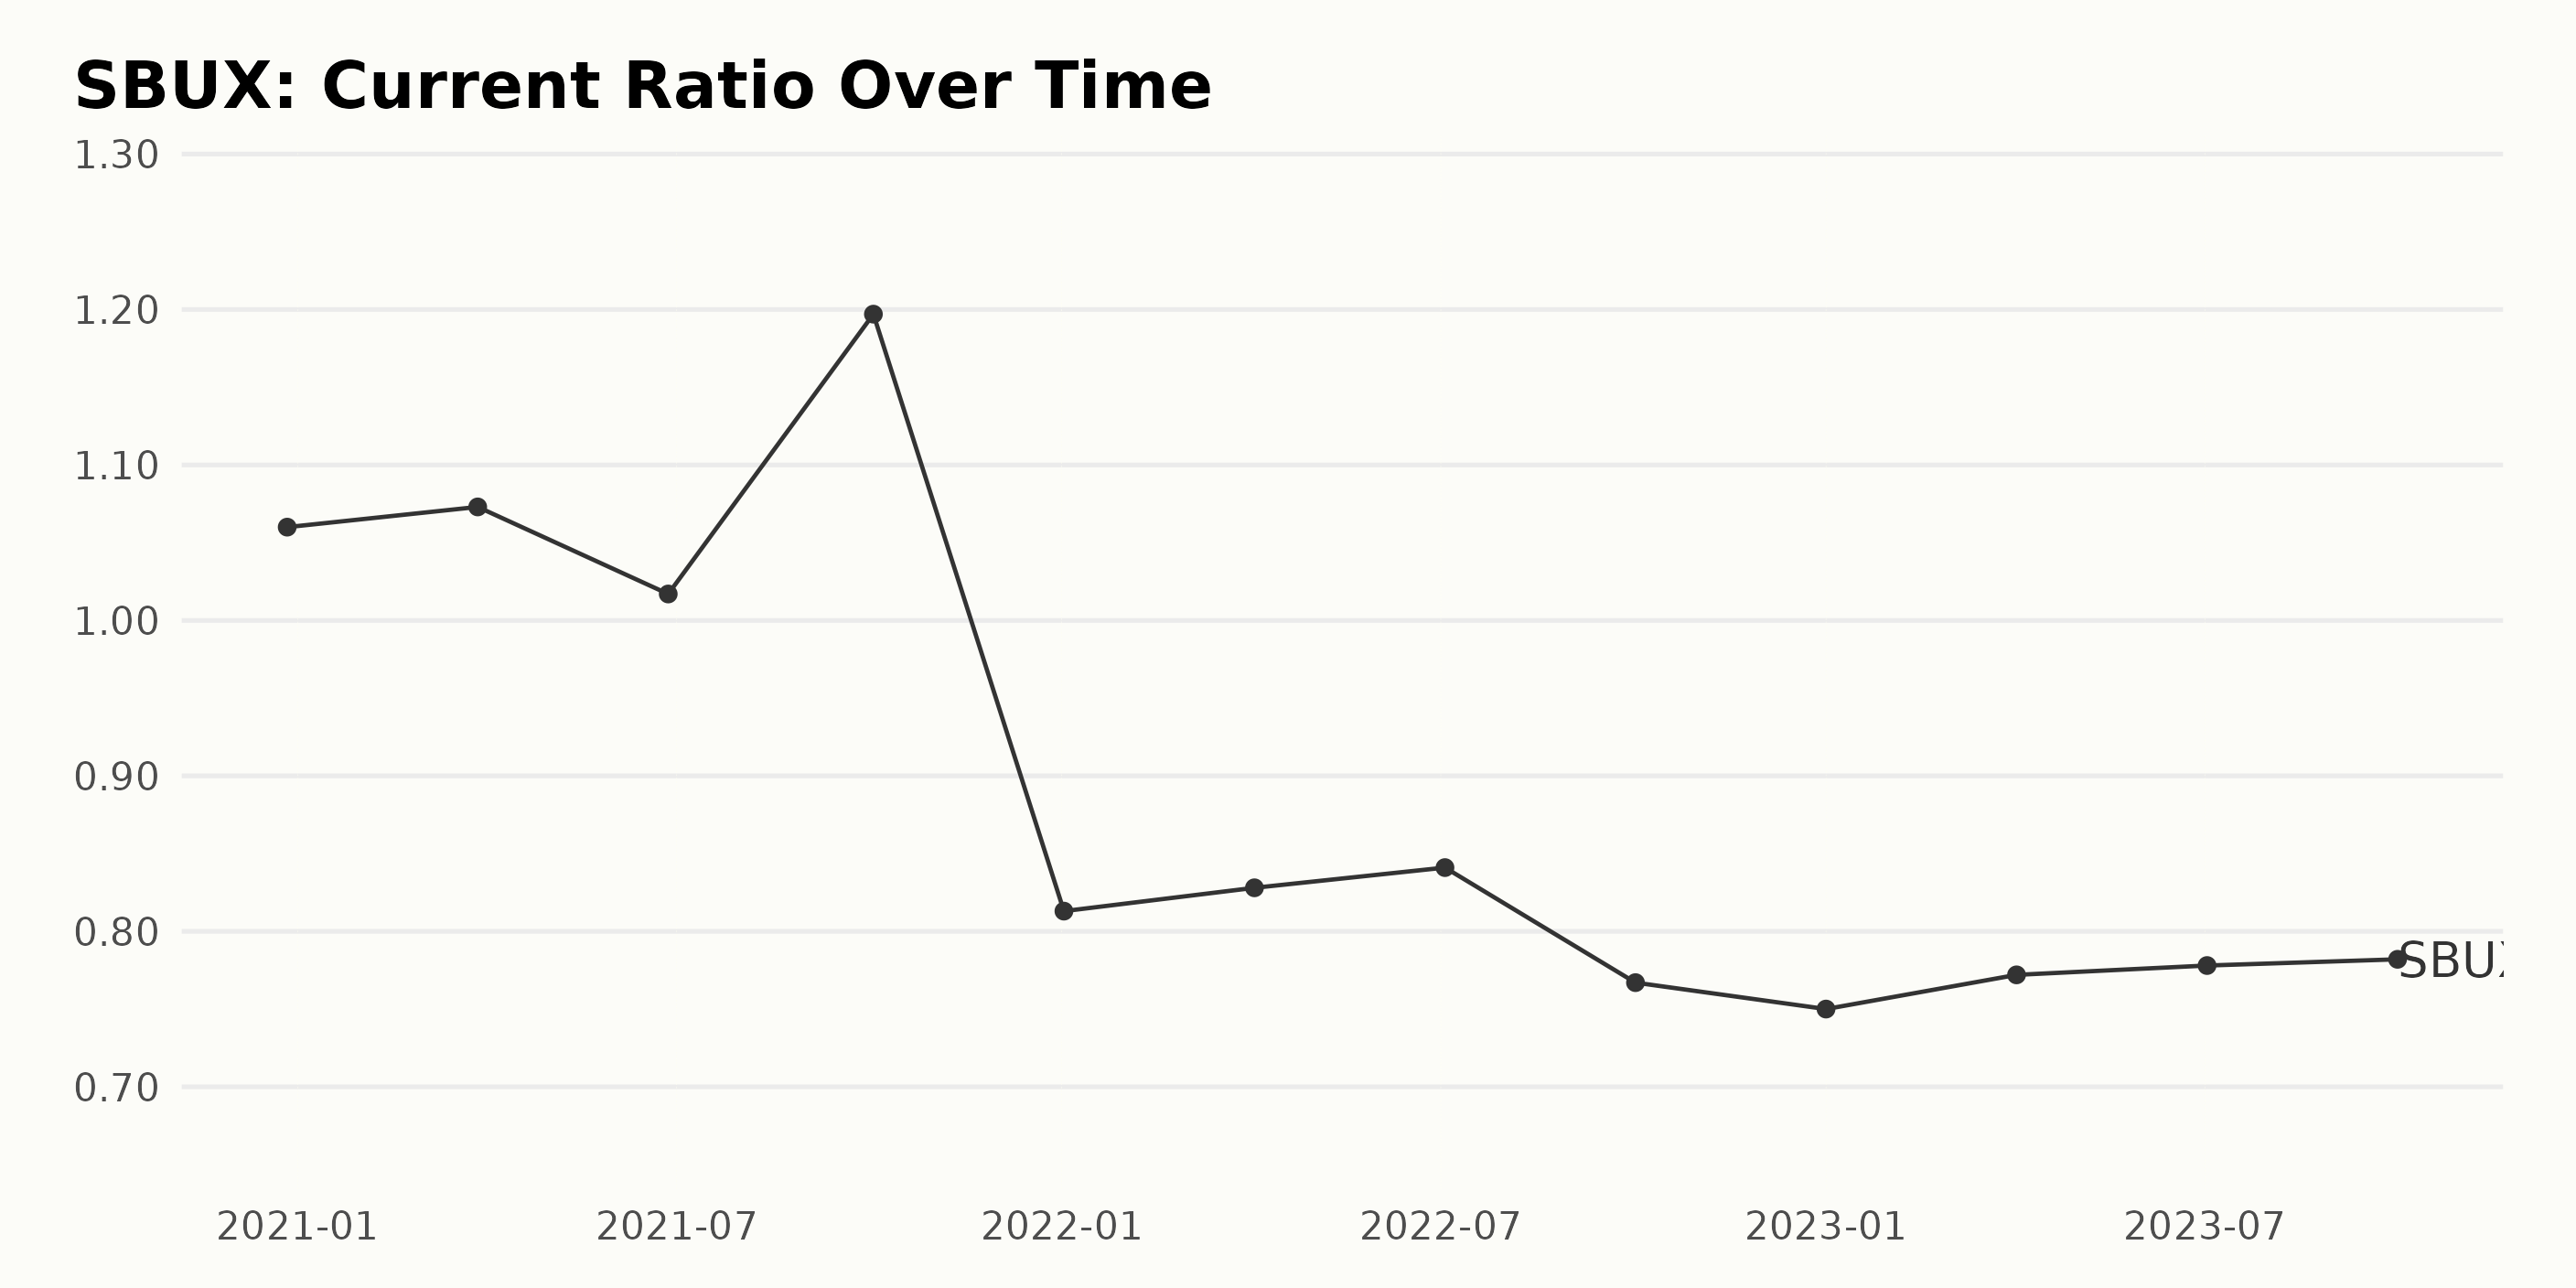
The series of data represents the evolution of the Current Ratio for Starbucks Corporation (SBUX) from December 2020 up until October 2023.
- Starting with a value of 1.06 on December 27, 2020, the Current Ratio experienced a slight increase, reaching 1.07 by March 28, 2021.
- Subsequently, it saw a marginal dip to 1.02 by June 27, 2021.
- A peak followed this decrease; by October 3, 2021, the ratio climbed to 1.2.
- However, from January 2, 2022, a marked downturn ensued as the Current Ratio declined steadily from 0.813, going as low as 0.767 in October that year.
- This trend broadly continued until the beginning of 2023, hitting a low of 0.75 on January 1.
- From April 2, 2023, SBUX's Current Ratio started to gradually recover, closing at a value of 0.782 on October 1, 2023.
Between the start date in December 2020 and the end date in October 2023, the Current Ratio decreased by approximately 26%, indicating a declining tendency for Starbucks Corporation's ability to cover its short-term liabilities with its short-term assets over this period. The emphasis on more recent data shows a slight surge in the Current Ratio after hitting the lowest point in January 2023, though the overall performance remains below the starting measure.
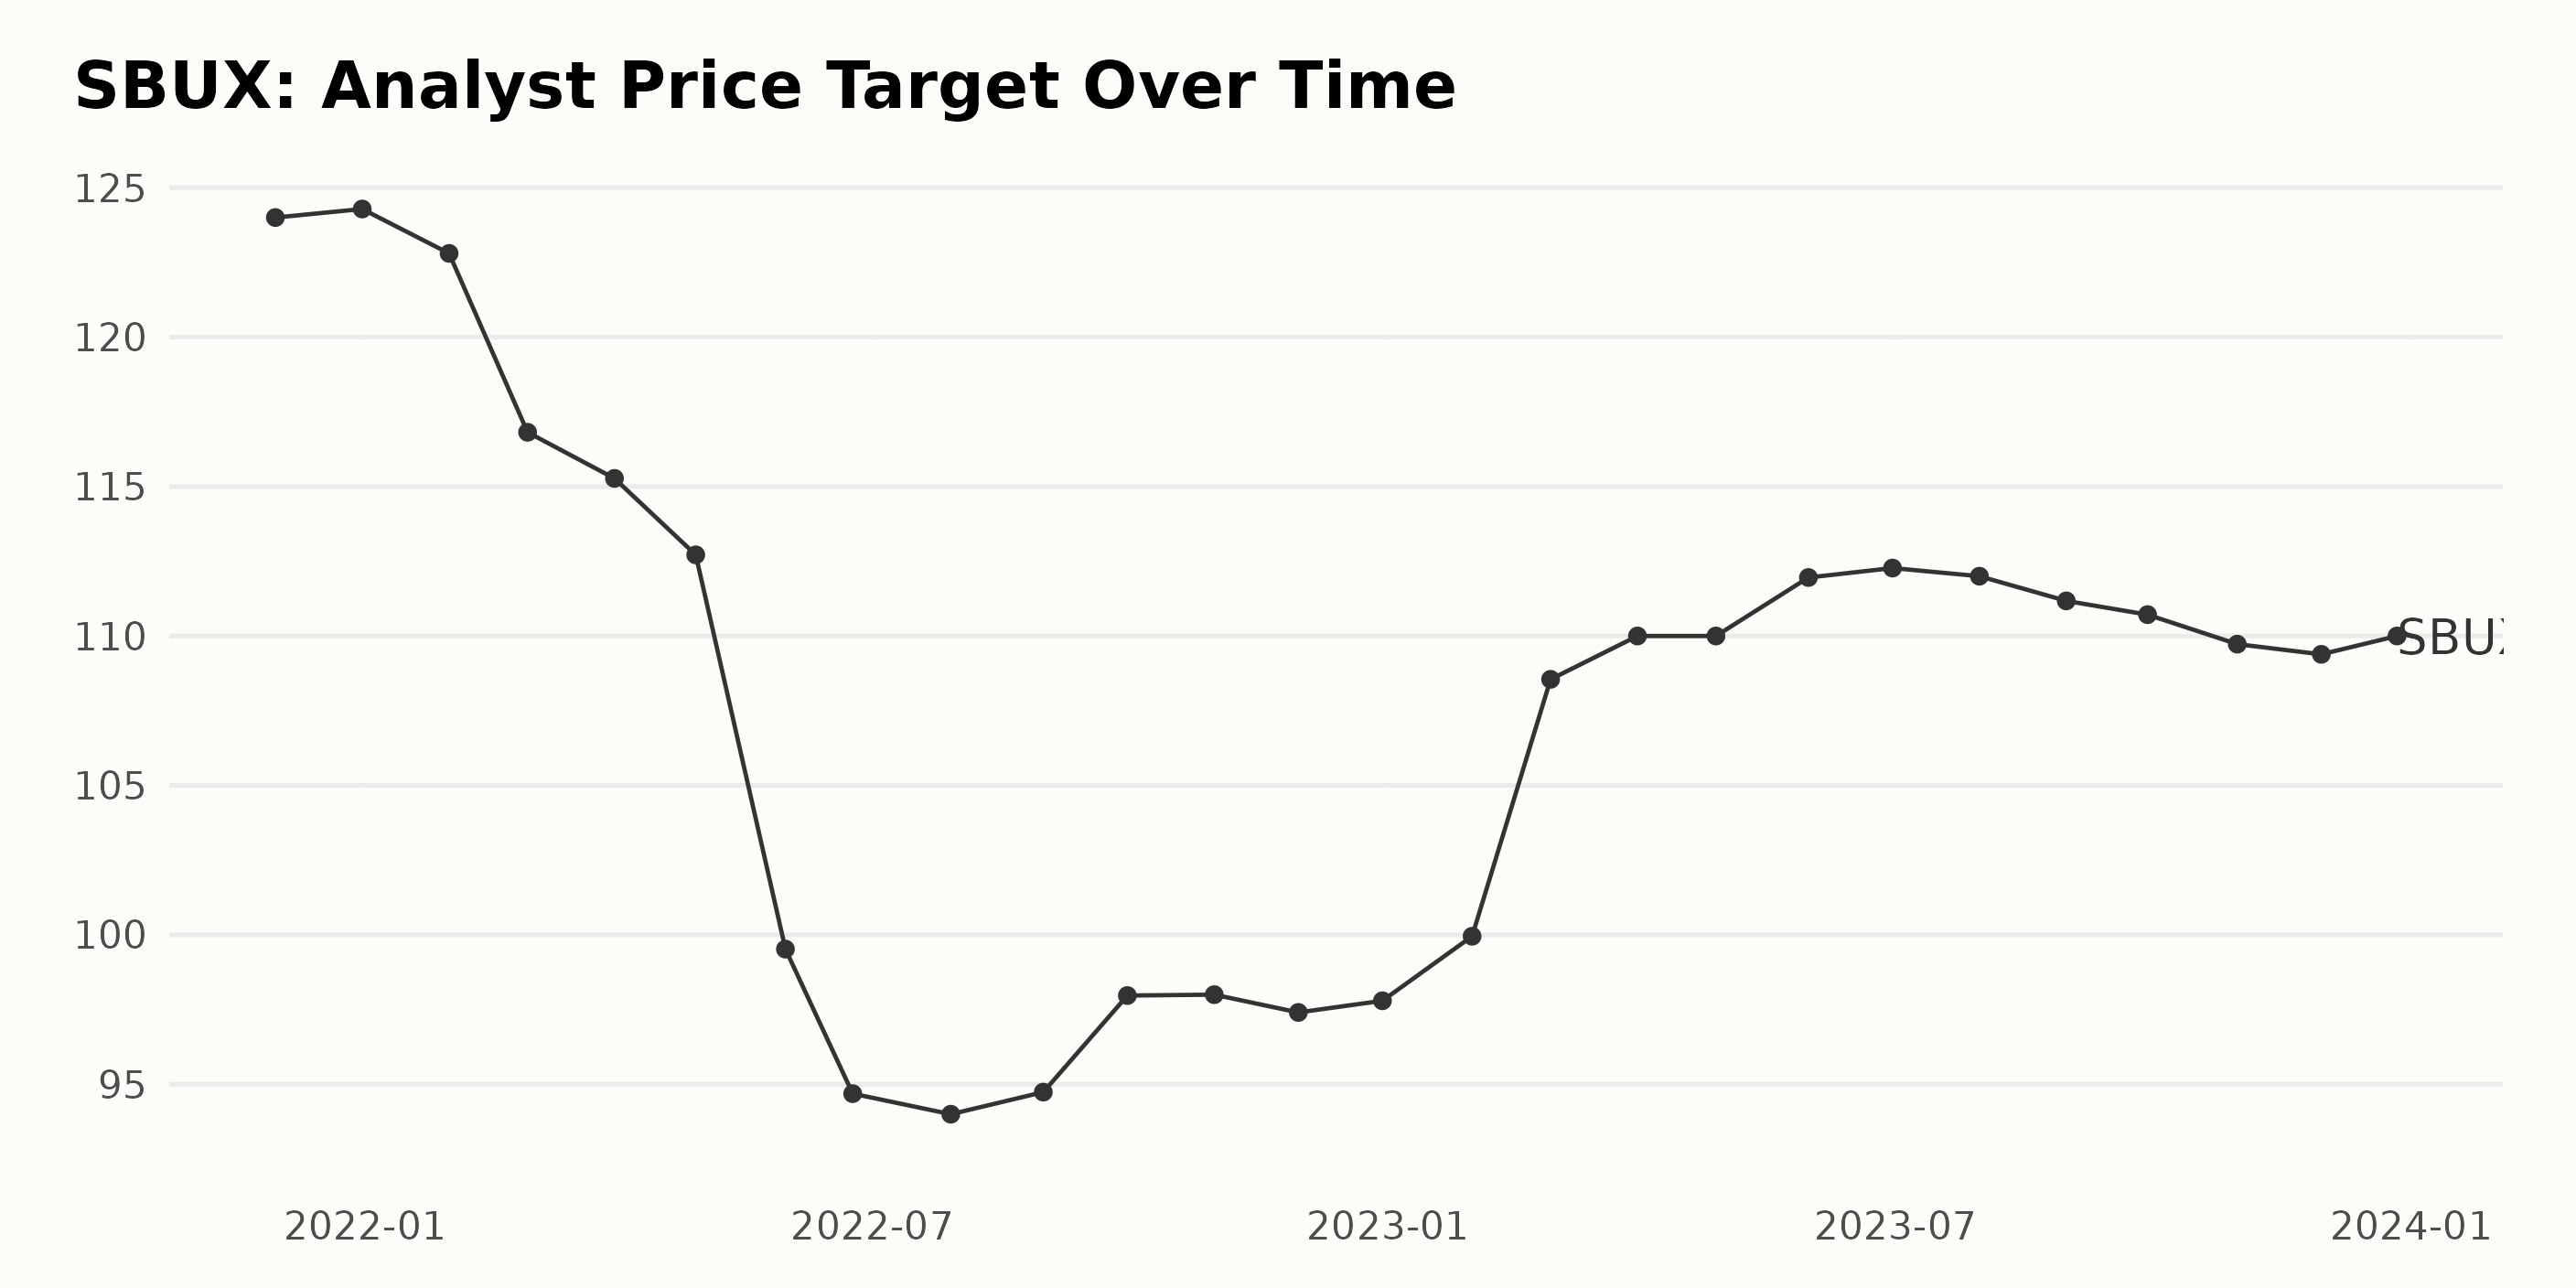
The following summary details the trend and fluctuations of the Analyst Price Target for SBUX from 2021 to 2023. Main Points:
- The data series begins with an Analyst Price Target of $124 in November 2021, experiencing marginal escalation to $124.28 by December 2021 before falling to $122.8 in January 2022.
- The price target witnessed a continued downward trend until June 2022 when it reached its lowest point at $94.68.
- The figure experienced minor fluctuations over the following months but remained generally around the mid-$90s until December 2022.
- In early 2023, there was a pronounced increase, bringing the Analyst Price Target back above the $100-mark. This resurgence continued until February 2023, where it peaked at $108.55.
- For the rest of 2023, the Analyst Price Target fluctuated slightly but essentially remained consistent around the low $110s.
- By the end of the series in December 2023, the Analyst Price Target was marginally below its peak for the year at $110.
Growth Rate: Between November 2021 and December 2023, the Analyst Price Target for SBUX decreased by roughly -11.3%, dropping from $124 to $110. With greater emphasis on the more recent data, it can be inferred that while Starbucks witnessed a sharp decline in its Analyst Price Target in the first half of 2022, recovery took place in 2023. Although the price target did not reach its initial levels, it largely maintained a steady rate around the $110 mark throughout the latter half of 2023.
Analyzing Volatility and Declining Trends in Starbucks Corporation's Share Prices
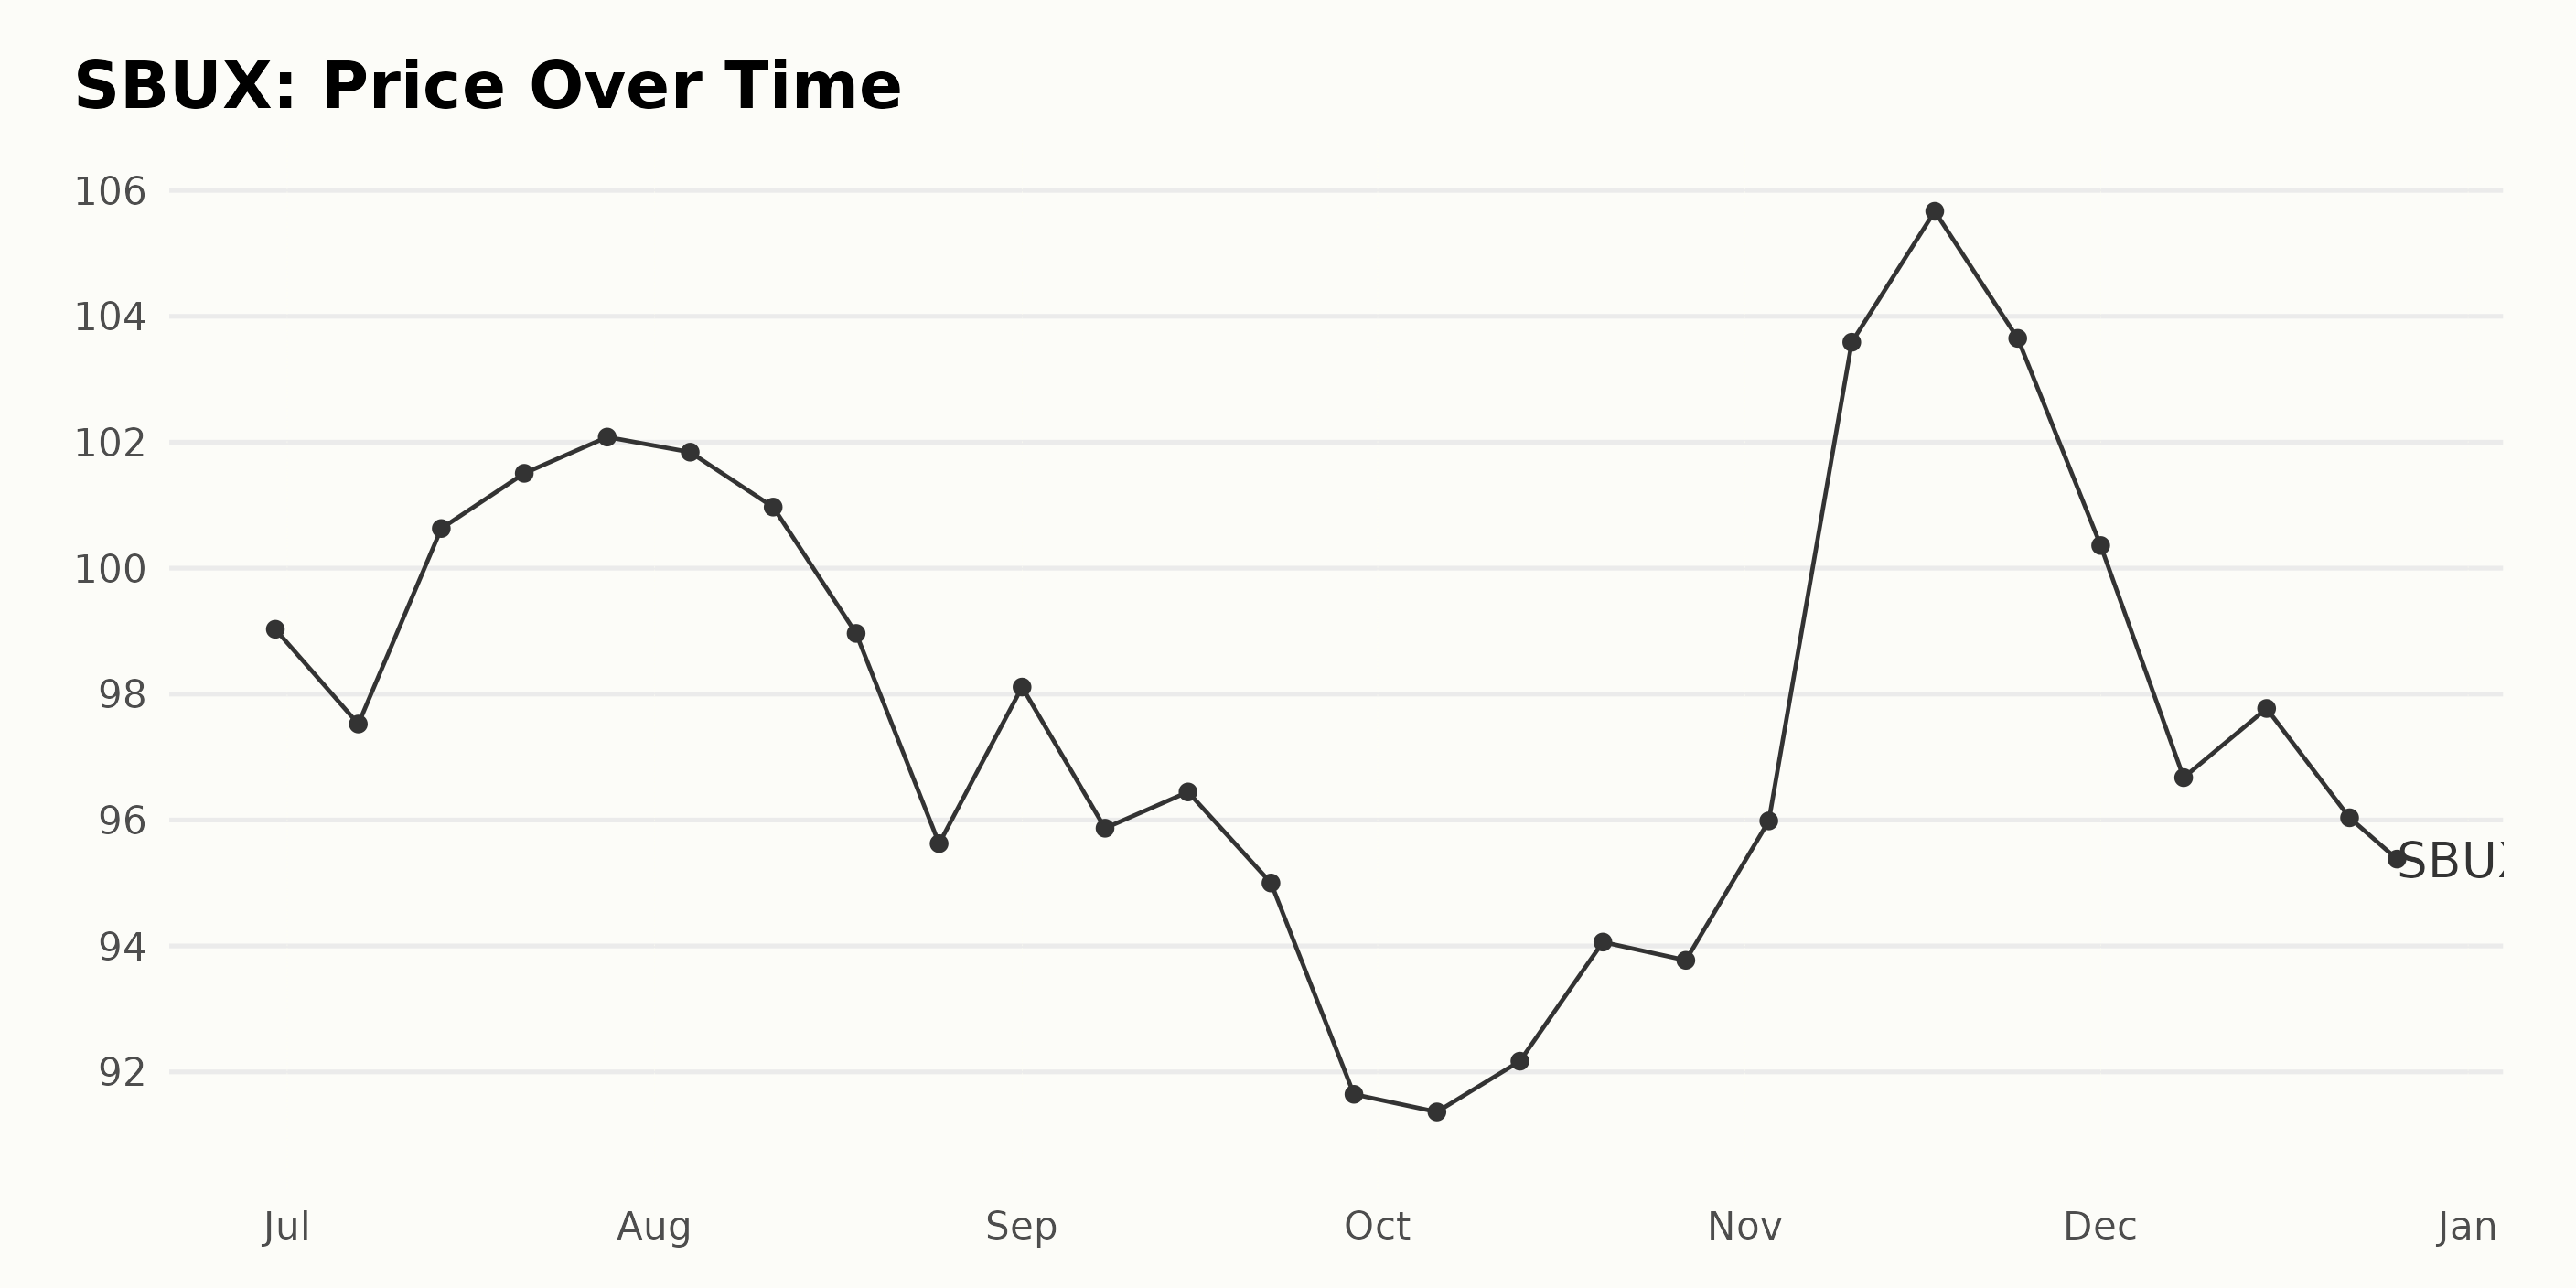
Here's a description of the trend and growth rate of Starbucks Corporation (SBUX) share prices based on the provided data:
- At the beginning, Starbucks' share price was $99.03 in June 2023.
- The share price saw a slight decrease to $97.525 in the first week of July 2023 but rebounded quickly to reach a peak of $102.082 at the end of July 2023.
- In August 2023, the share price began to fluctuate, initially decreasing to $95.626 by August 25 but experiencing a brief recovery to $100.97 earlier in the month.
- From the end of August 2023 through September, there was a clear downward trend with the price falling to as low as $91.644 by the end of September 2023.
- The share price remained relatively stable around the low $90s in early to mid-October 2023.
- In November 2023, the share price saw significant growth, peaking at $105.668 by mid-November. This represents the highest value recorded in this dataset.
- However, the share price witnessed a decline again closing the year 2023 at $95.38 on December 26.
Clearly, there is a significant amount of fluctuation in the share price of Starbucks Corporation (SBUX) during this period indicating volatility in its market value. Although the share price reached a high point in November, it has generally shown a decelerating trend from mid-July through the end of the given data range in December 2023. Here is a chart of SBUX's price over the past 180 days.
Analyzing Starbucks' Performance: Momentum, Quality, and Stability Ratings Overview
SBUX has an overall C rating, translating to a Neutral in our POWR Ratings system. It is ranked #16 out of the 44 stocks in the Restaurants category.
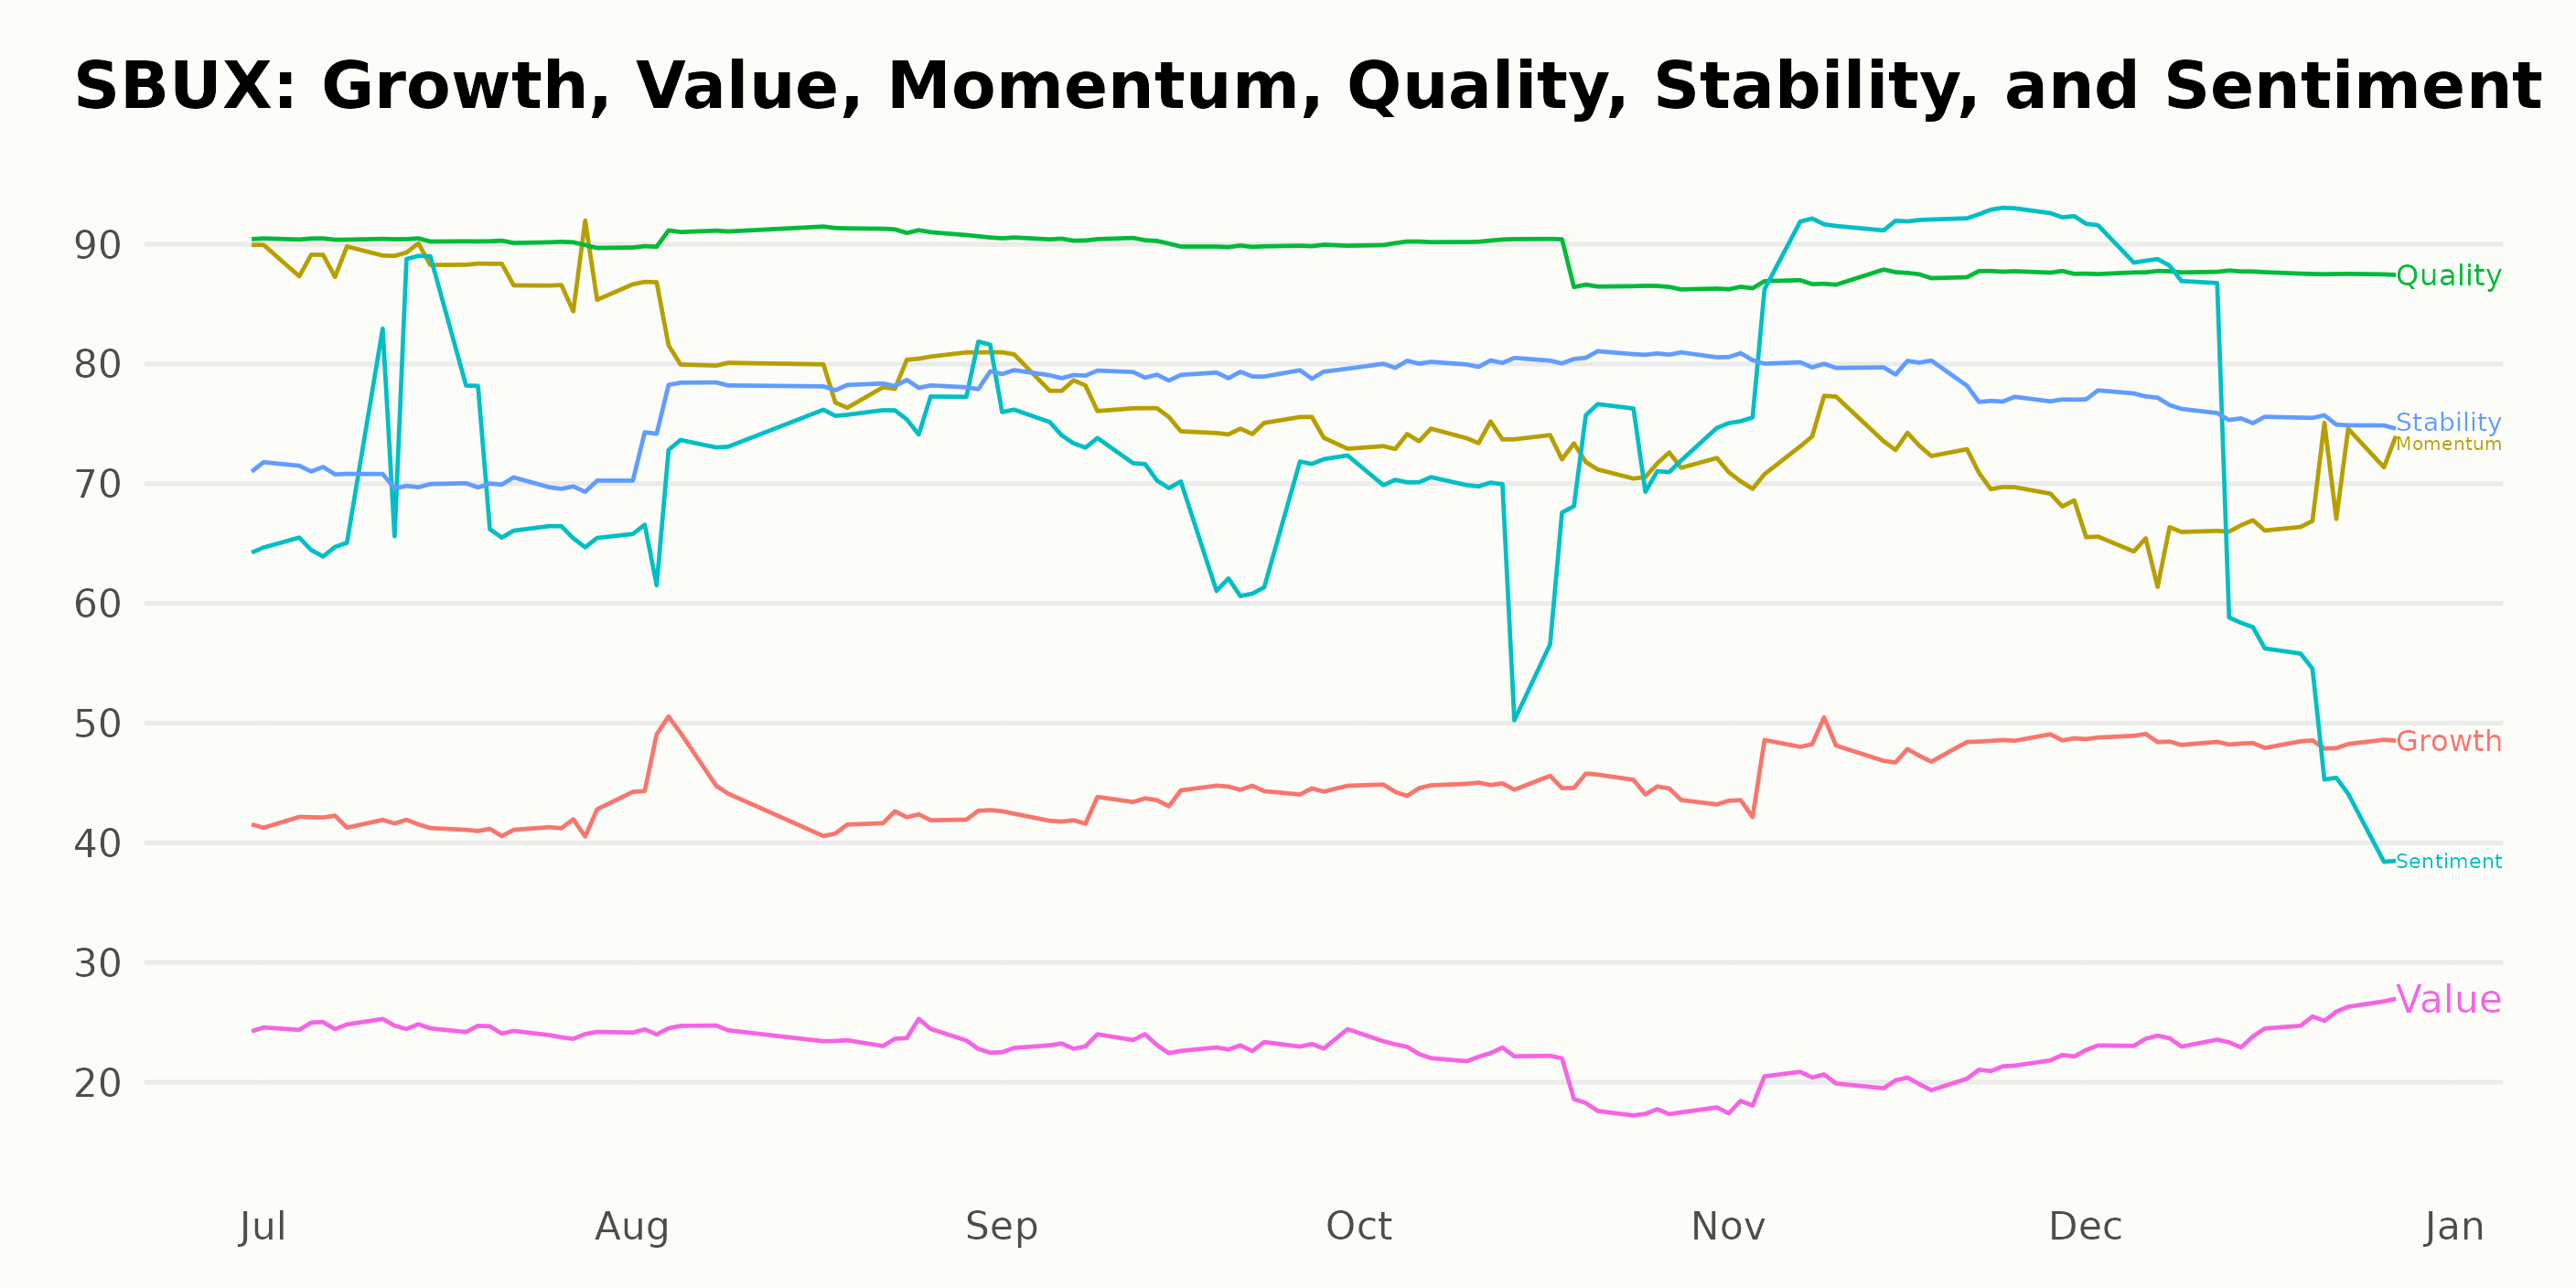
The POWR Ratings for SBUX offers insights into the company's performance along various dimensions. The three most noteworthy dimensions over the given period include Momentum, Quality, and Stability.
- Momentum: This dimension saw the highest rating for SBUX at 90 in June 2023. However, a clear downward trend can be observed in this rating, with the ratings dropping gradually to 67 by December 27, 2023.
- Quality: For the Quality dimension, SBUX started with an impressive rating of 90 in June 2023, maintaining it until September 30, 2023. Though there was a slight decline in the subsequent months, it still posted a strong score of 88 on December 27, 2023.
- Stability: The Stability ratings for SBUX have followed a slightly volatile but overall upward trend. Starting from a rating of 71 in June 2023, the stability rating increased to reach its peak at 80 by October 31, 2023. It subsequently moderated to 76 on December 27, 2023.
These trends suggest that while SBUX showed signs of decelerating momentum, it continued to showcase high quality and stability throughout the specified period.
How does Starbucks Corporation (SBUX) Stack Up Against its Peers?
Other stocks in the Restaurants sector that may be worth considering are Rave Restaurant Group Inc. (RAVE), Nathan's Famous Inc. (NATH), and Domino's Pizza Group plc (DPUKY) -- they have better POWR Ratings.
What To Do Next?
Get your hands on this special report with 3 low priced companies with tremendous upside potential even in today’s volatile markets:
3 Stocks to DOUBLE This Year >
SBUX shares were trading at $95.09 per share on Wednesday afternoon, down $0.58 (-0.61%). Year-to-date, SBUX has declined -2.13%, versus a 26.46% rise in the benchmark S&P 500 index during the same period.
About the Author: Subhasree Kar

Subhasree’s keen interest in financial instruments led her to pursue a career as an investment analyst. After earning a Master’s degree in Economics, she gained knowledge of equity research and portfolio management at Finlatics.
The post Analyzing the Year-End Performance of Starbucks (SBUX) appeared first on StockNews.com