

Home and security products company Fortune Brands (NYSE: FBIN) missed Wall Street’s revenue expectations in Q4 CY2025, with sales falling 2.4% year on year to $1.08 billion. Its GAAP profit of $0.63 per share was 36.5% below analysts’ consensus estimates.
Is now the time to buy Fortune Brands? Find out by accessing our full research report, it’s free.
Fortune Brands (FBIN) Q4 CY2025 Highlights:
- Revenue: $1.08 billion vs analyst estimates of $1.14 billion (2.4% year-on-year decline, 5.5% miss)
- EPS (GAAP): $0.63 vs analyst expectations of $0.99 (36.5% miss)
- Adjusted EBITDA: $201.1 million vs analyst estimates of $232.7 million (18.7% margin, 13.6% miss)
- EPS (GAAP) guidance for the upcoming financial year 2026 is $3.50 at the midpoint, missing analyst estimates by 14.4%
- Operating Margin: 11.3%, down from 16.1% in the same quarter last year
- Free Cash Flow Margin: 21.6%, up from 19.2% in the same quarter last year
- Market Capitalization: $7.58 billion
“In the fourth quarter and for the full year, our team navigated a challenging external environment. I’m proud of the way we responded to the external uncertainty while still driving meaningful progress across our strategic initiatives,” said Fortune Brands Chief Executive Officer Nicholas Fink.
Company Overview
Targeting a wide customer base of residential and commercial customers, Fortune Brands (NYSE: FBIN) makes plumbing, security, and outdoor living products.
Revenue Growth
A company’s long-term sales performance is one signal of its overall quality. Any business can have short-term success, but a top-tier one grows for years. Unfortunately, Fortune Brands’s 4.3% annualized revenue growth over the last five years was sluggish. This was below our standard for the industrials sector and is a rough starting point for our analysis.
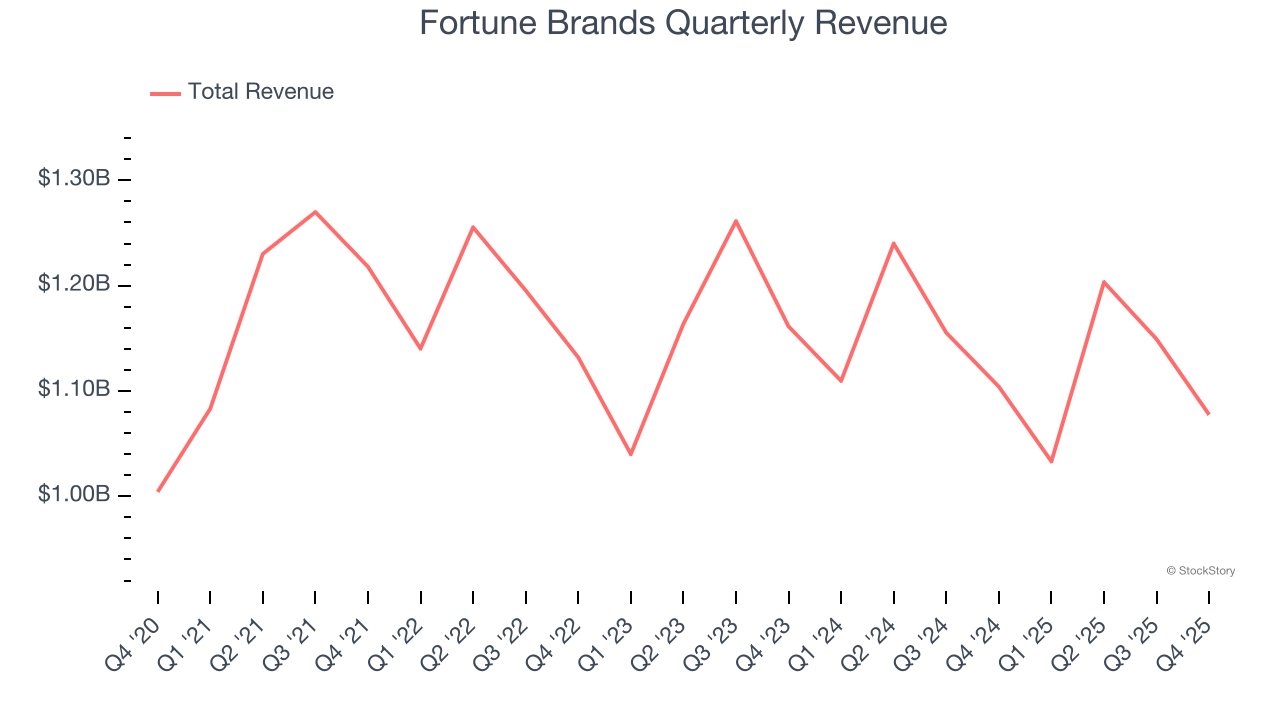
We at StockStory place the most emphasis on long-term growth, but within industrials, a half-decade historical view may miss cycles, industry trends, or a company capitalizing on catalysts such as a new contract win or a successful product line. Fortune Brands’s performance shows it grew in the past but relinquished its gains over the last two years, as its revenue fell by 1.8% annually. 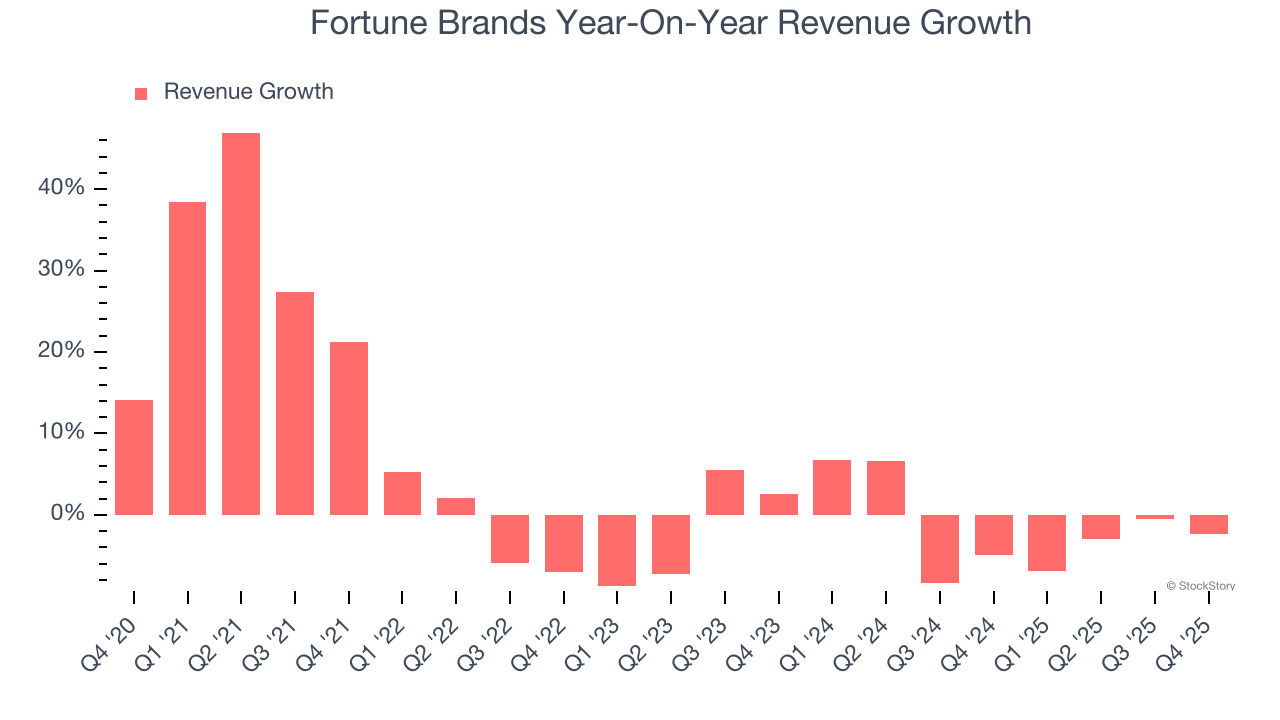
This quarter, Fortune Brands missed Wall Street’s estimates and reported a rather uninspiring 2.4% year-on-year revenue decline, generating $1.08 billion of revenue.
Looking ahead, sell-side analysts expect revenue to grow 3.6% over the next 12 months. Although this projection suggests its newer products and services will fuel better top-line performance, it is still below average for the sector.
The 1999 book Gorilla Game predicted Microsoft and Apple would dominate tech before it happened. Its thesis? Identify the platform winners early. Today, enterprise software companies embedding generative AI are becoming the new gorillas. a profitable, fast-growing enterprise software stock that is already riding the automation wave and looking to catch the generative AI next.
Operating Margin
Fortune Brands has been a well-oiled machine over the last five years. It demonstrated elite profitability for an industrials business, boasting an average operating margin of 15.8%. This result isn’t surprising as its high gross margin gives it a favorable starting point.
Looking at the trend in its profitability, Fortune Brands’s operating margin decreased by 9.8 percentage points over the last five years. This raises questions about the company’s expense base because its revenue growth should have given it leverage on its fixed costs, resulting in better economies of scale and profitability.
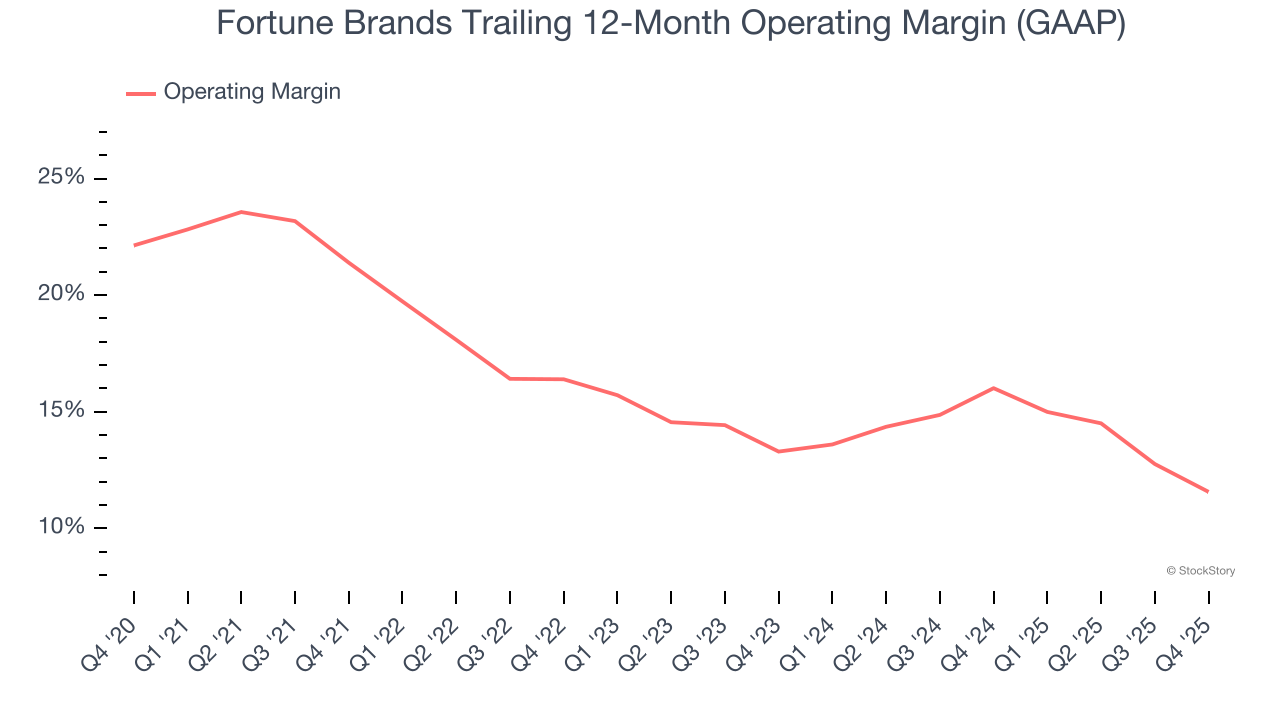
This quarter, Fortune Brands generated an operating margin profit margin of 11.3%, down 4.9 percentage points year on year. Since Fortune Brands’s operating margin decreased more than its gross margin, we can assume it was less efficient because expenses such as marketing, R&D, and administrative overhead increased.
Earnings Per Share
Revenue trends explain a company’s historical growth, but the long-term change in earnings per share (EPS) points to the profitability of that growth – for example, a company could inflate its sales through excessive spending on advertising and promotions.
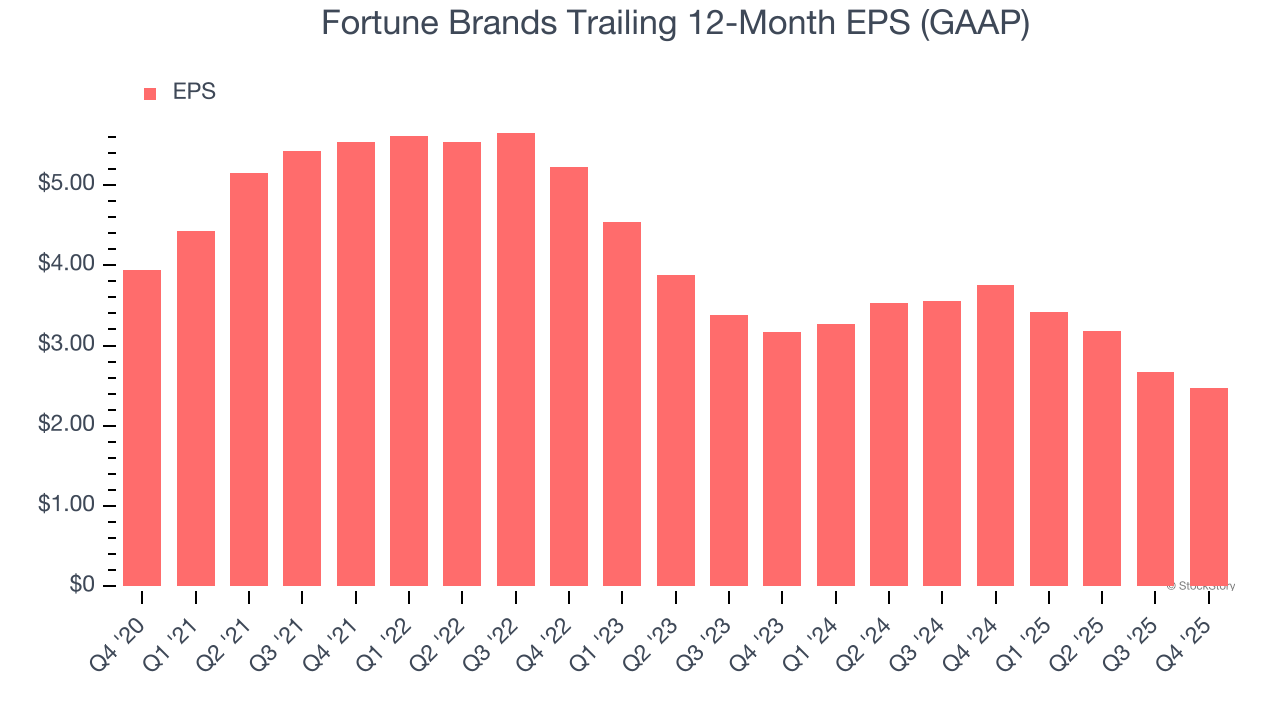
Sadly for Fortune Brands, its EPS declined by 9% annually over the last five years while its revenue grew by 4.3%. This tells us the company became less profitable on a per-share basis as it expanded due to non-fundamental factors such as interest expenses and taxes.
Diving into the nuances of Fortune Brands’s earnings can give us a better understanding of its performance. As we mentioned earlier, Fortune Brands’s operating margin declined by 9.8 percentage points over the last five years. This was the most relevant factor (aside from the revenue impact) behind its lower earnings; interest expenses and taxes can also affect EPS but don’t tell us as much about a company’s fundamentals.
Like with revenue, we analyze EPS over a more recent period because it can provide insight into an emerging theme or development for the business.
For Fortune Brands, its two-year annual EPS declines of 11.7% show it’s continued to underperform. These results were bad no matter how you slice the data.
In Q4, Fortune Brands reported EPS of $0.63, down from $0.84 in the same quarter last year. This print missed analysts’ estimates. Over the next 12 months, Wall Street expects Fortune Brands’s full-year EPS of $2.47 to grow 66%.
Key Takeaways from Fortune Brands’s Q4 Results
We struggled to find many positives in these results. Its full-year EPS guidance missed and its revenue fell short of Wall Street’s estimates. Overall, this was a softer quarter. The stock traded down 12.2% to $54.65 immediately following the results.
Fortune Brands may have had a tough quarter, but does that actually create an opportunity to invest right now? If you’re making that decision, you should consider the bigger picture of valuation, business qualities, as well as the latest earnings. We cover that in our actionable full research report which you can read here (it’s free).


