Freight Delivery Company RXO (NYSE: RXO) missed Wall Street’s revenue expectations in Q2 CY2025, but sales rose 52.6% year on year to $1.42 billion. Its non-GAAP profit of $0.04 per share was $0.01 above analysts’ consensus estimates.
Is now the time to buy RXO? Find out by accessing our full research report, it’s free.
RXO (RXO) Q2 CY2025 Highlights:
- Revenue: $1.42 billion vs analyst estimates of $1.43 billion (52.6% year-on-year growth, 1% miss)
- Adjusted EPS: $0.04 vs analyst estimates of $0.03 ($0.01 beat)
- Adjusted EBITDA: $38 million vs analyst estimates of $33.24 million (2.7% margin, 14.3% beat)
- EBITDA guidance for Q3 CY2025 is $38 million at the midpoint, in line with analyst expectations
- Operating Margin: 0%, in line with the same quarter last year
- Free Cash Flow was $23 million, up from -$16 million in the same quarter last year
- Sales Volumes rose 1% year on year (4% in the same quarter last year)
- Market Capitalization: $2.53 billion
RXO Chairman and CEO Drew Wilkerson said, “RXO executed well in the second quarter despite the prolonged soft freight market. Our Brokerage business outperformed the market, growing volume by 1% year-over-year driven by 45% growth in less-than-truckload volume. We’re seeing early benefits from our newly combined carrier and coverage operations, and we delivered Brokerage gross margin of 14.4% in the quarter. Last Mile continued its impressive run of year-over-year growth, achieving 17% stop growth, the fourth consecutive quarter of double-digit growth. Our cash performance in the quarter was strong, and we increased our cash balance sequentially from the first quarter.”
Company Overview
With access to millions of trucks, RXO (NYSE: RXO) offers full-truckload, less-than-truckload, and last-mile deliveries.
Revenue Growth
A company’s long-term performance is an indicator of its overall quality. Any business can put up a good quarter or two, but the best consistently grow over the long haul. Thankfully, RXO’s 15.5% annualized revenue growth over the last five years was incredible. Its growth beat the average industrials company and shows its offerings resonate with customers.
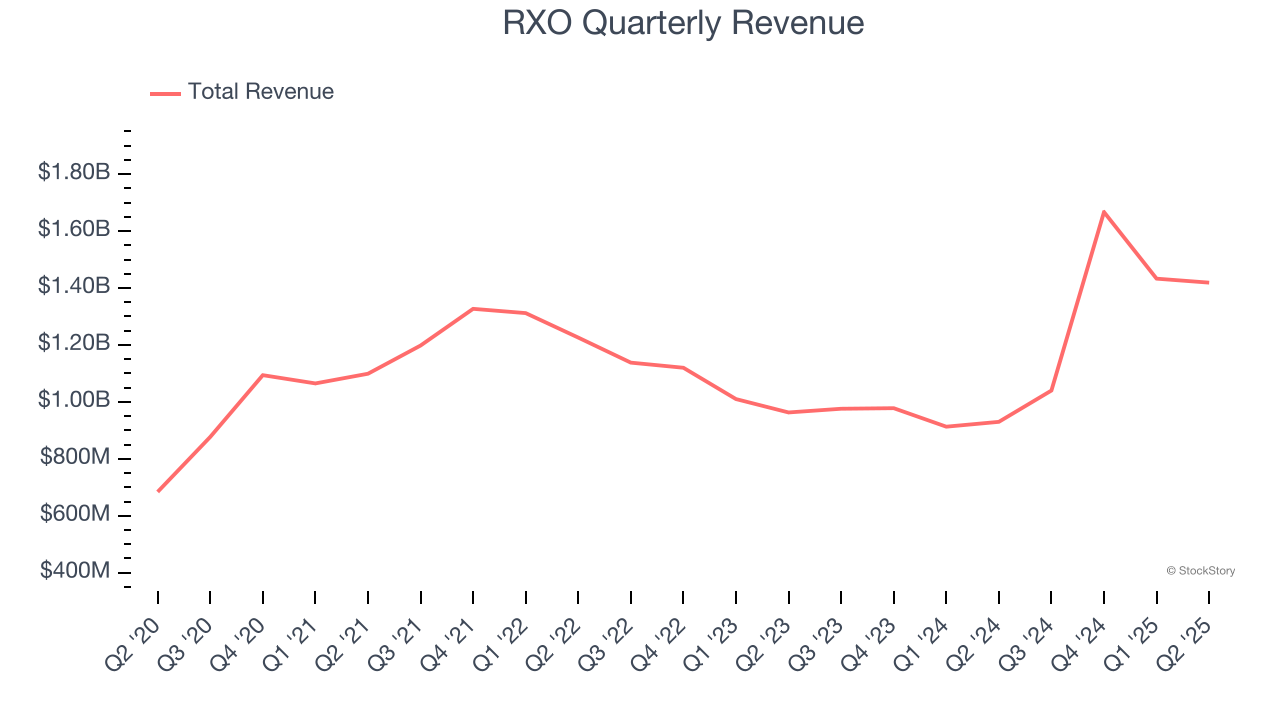
We at StockStory place the most emphasis on long-term growth, but within industrials, a half-decade historical view may miss cycles, industry trends, or a company capitalizing on catalysts such as a new contract win or a successful product line. RXO’s annualized revenue growth of 14.6% over the last two years aligns with its five-year trend, suggesting its demand was predictably strong. RXO recent performance stands out, especially when considering many similar Ground Transportation businesses faced declining sales because of cyclical headwinds. 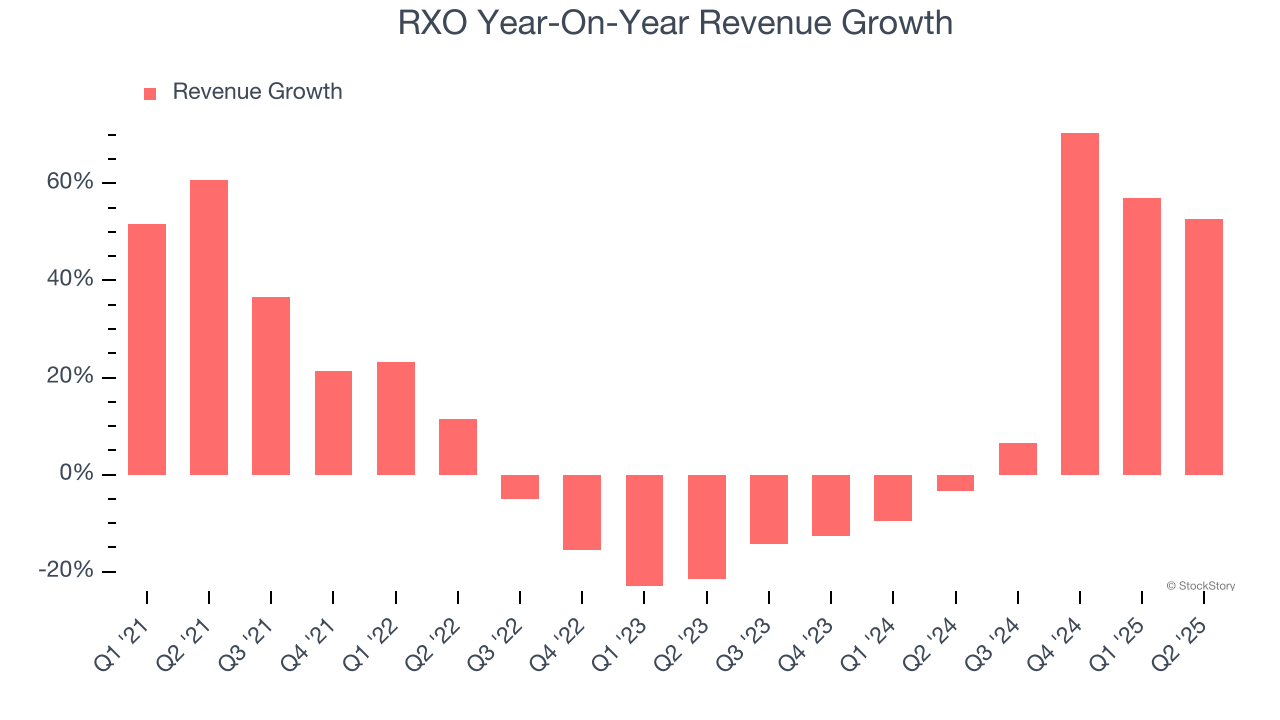
We can dig further into the company’s revenue dynamics by analyzing its number of units sold. Over the last two years, RXO’s units sold averaged 47.4% year-on-year growth. Because this number is better than its revenue growth, we can see the company’s average selling price decreased. 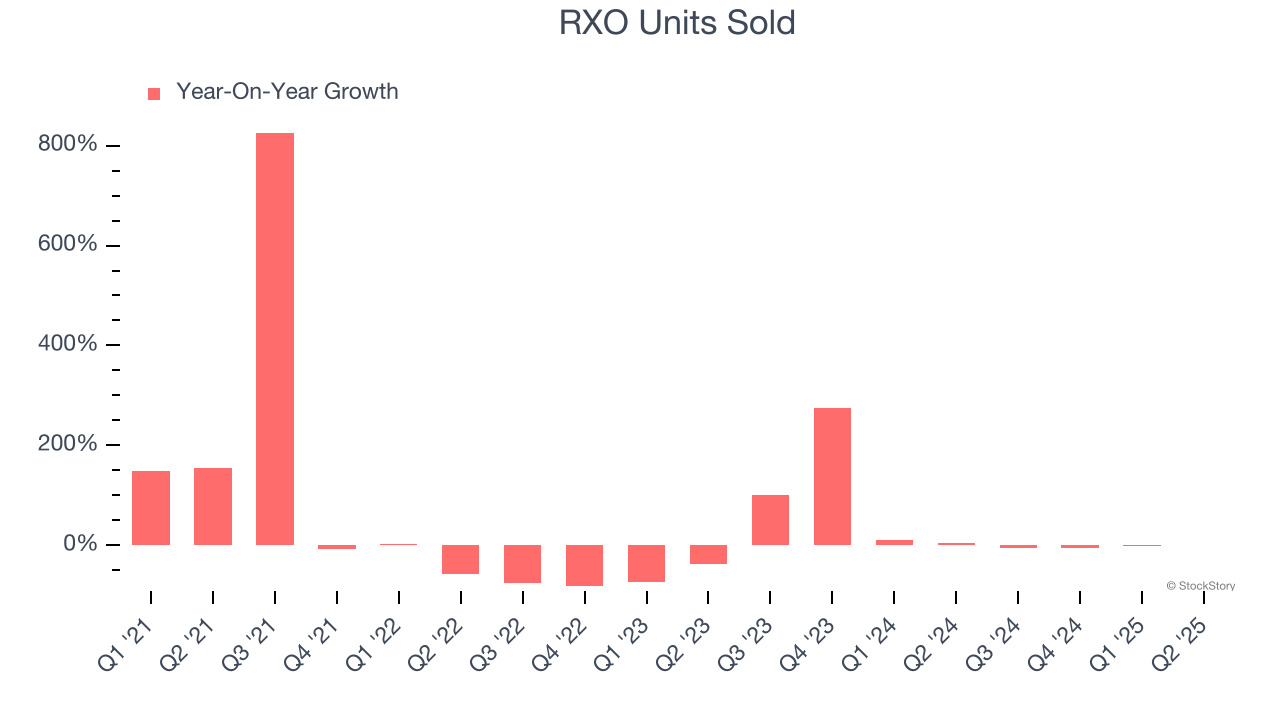
This quarter, RXO achieved a magnificent 52.6% year-on-year revenue growth rate, but its $1.42 billion of revenue fell short of Wall Street’s lofty estimates.
Looking ahead, sell-side analysts expect revenue to grow 12.4% over the next 12 months, a slight deceleration versus the last two years. Despite the slowdown, this projection is commendable and indicates the market is forecasting success for its products and services.
Here at StockStory, we certainly understand the potential of thematic investing. Diverse winners from Microsoft (MSFT) to Alphabet (GOOG), Coca-Cola (KO) to Monster Beverage (MNST) could all have been identified as promising growth stories with a megatrend driving the growth. So, in that spirit, we’ve identified a relatively under-the-radar profitable growth stock benefiting from the rise of AI, available to you FREE via this link.
Operating Margin
RXO was profitable over the last five years but held back by its large cost base. Its average operating margin of 1.5% was weak for an industrials business. This result isn’t too surprising given its low gross margin as a starting point.
Looking at the trend in its profitability, RXO’s operating margin decreased by 5.6 percentage points over the last five years. This raises questions about the company’s expense base because its revenue growth should have given it leverage on its fixed costs, resulting in better economies of scale and profitability. We’ve noticed many Ground Transportation companies also saw their margins fall (along with revenue, as mentioned above) because the cycle turned in the wrong direction, but RXO’s performance was poor no matter how you look at it. It shows that costs were rising and it couldn’t pass them onto its customers.
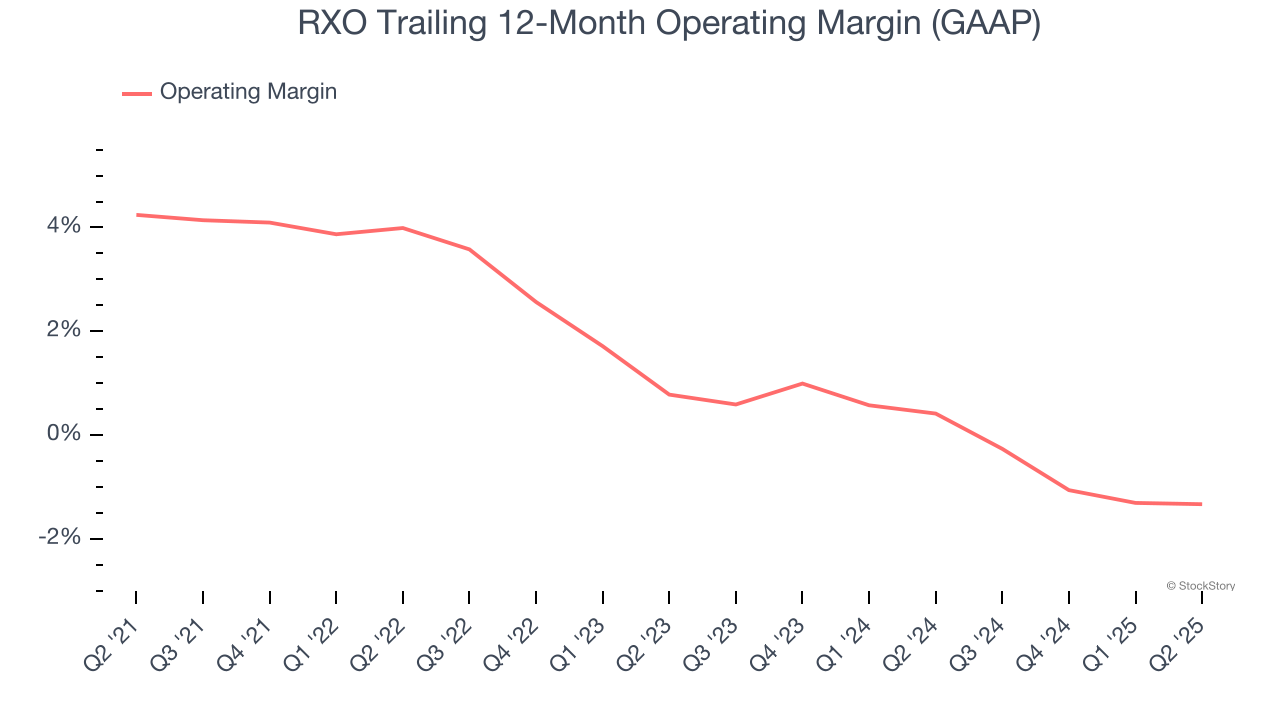
In Q2, RXO’s breakeven margin was in line with the same quarter last year. This indicates the company’s cost structure has recently been stable.
Earnings Per Share
Revenue trends explain a company’s historical growth, but the long-term change in earnings per share (EPS) points to the profitability of that growth – for example, a company could inflate its sales through excessive spending on advertising and promotions.
RXO’s full-year EPS flipped from negative to positive over the last five years. This is encouraging and shows it’s at a critical moment in its life.
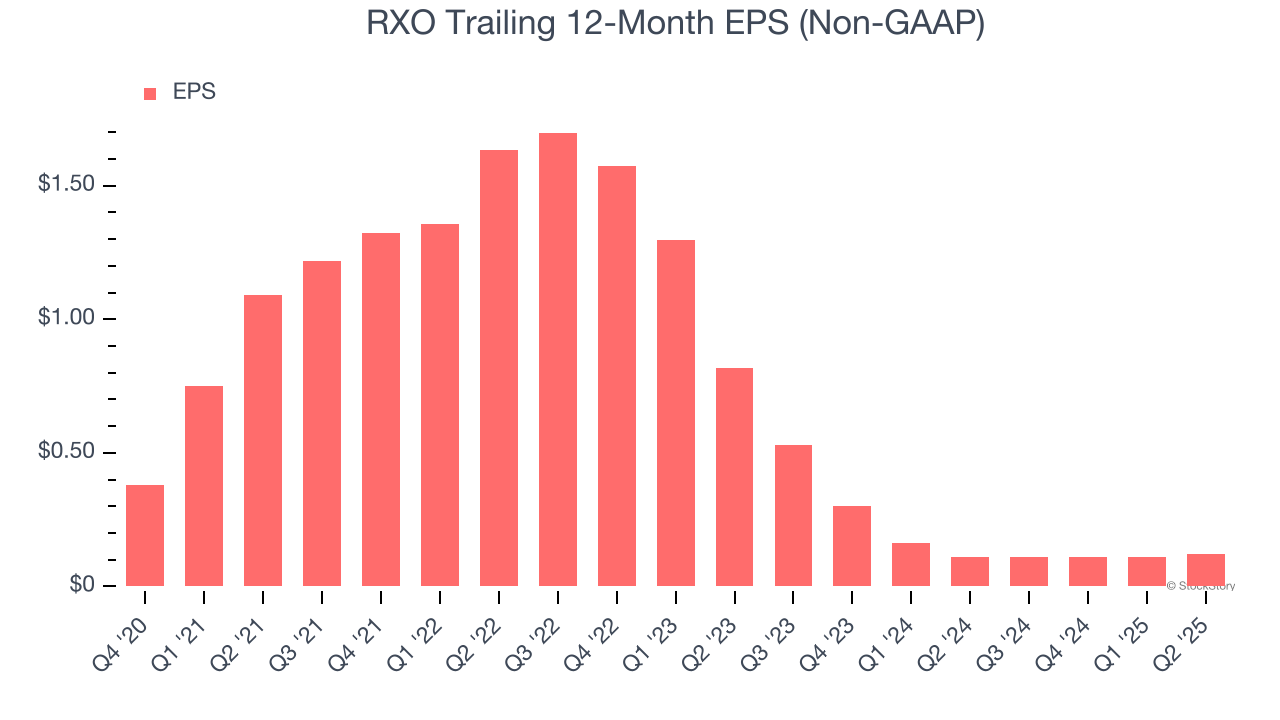
Like with revenue, we analyze EPS over a more recent period because it can provide insight into an emerging theme or development for the business.
Sadly for RXO, its EPS declined by 61.7% annually over the last two years while its revenue grew by 14.6%. This tells us the company became less profitable on a per-share basis as it expanded.
We can take a deeper look into RXO’s earnings to better understand the drivers of its performance. We mentioned earlier that RXO’s operating margin was flat this quarter, but a two-year view shows its margin has declined by 1.5 percentage pointswhile its share count has grown 41.1%. This means the company not only became less efficient with its operating expenses but also diluted its shareholders. 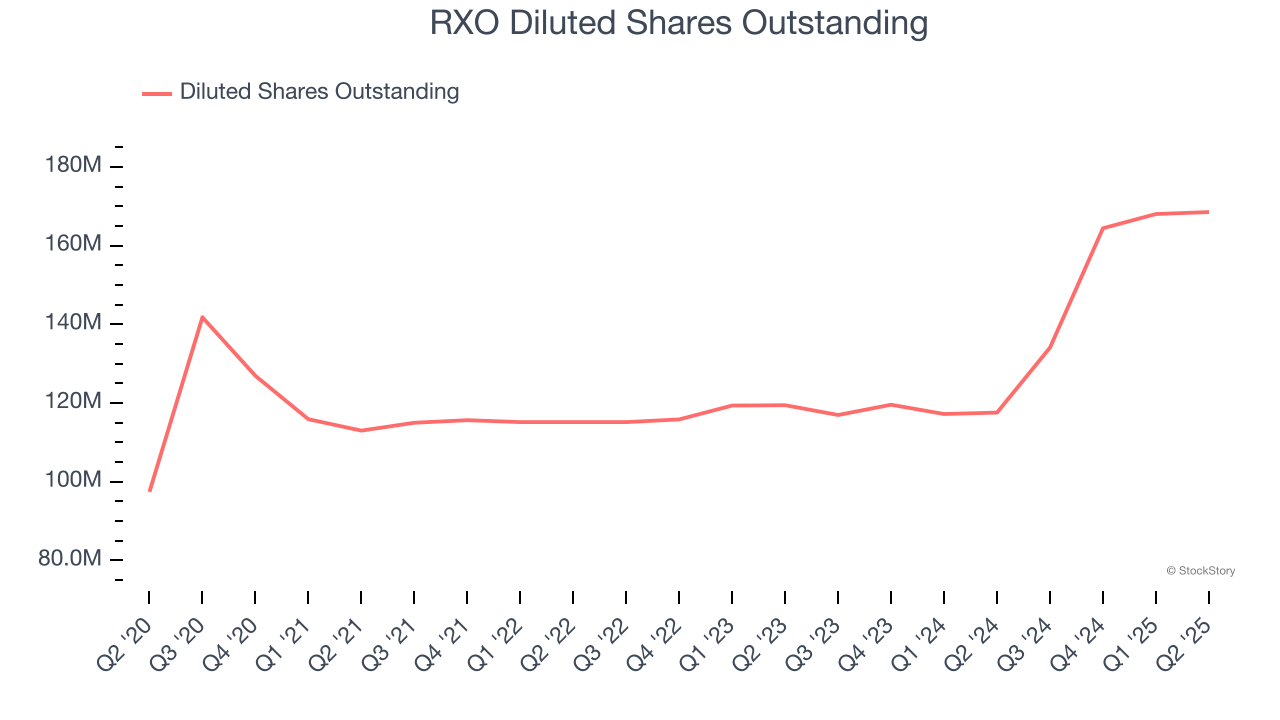
In Q2, RXO reported adjusted EPS at $0.04, up from $0.03 in the same quarter last year. This print easily cleared analysts’ estimates, and shareholders should be content with the results. Over the next 12 months, Wall Street expects RXO to perform poorly. Analysts forecast its full-year EPS of $0.12 will hit $0.27.
Key Takeaways from RXO’s Q2 Results
We were impressed by how significantly RXO blew past analysts’ EPS expectations this quarter. We were also excited its EBITDA outperformed Wall Street’s estimates by a wide margin. On the other hand, its revenue slightly missed. Overall, we think this was a decent quarter with some key metrics above expectations. The market seemed to be hoping for more, and the stock traded down 1.9% to $15.15 immediately following the results.
So do we think RXO is an attractive buy at the current price? When making that decision, it’s important to consider its valuation, business qualities, as well as what has happened in the latest quarter. We cover that in our actionable full research report which you can read here, it’s free.