

Business management solutions provider Barrett Business Services (NASDAQ: BBSI) reported Q2 CY2025 results topping the market’s revenue expectations, with sales up 10% year on year to $307.7 million. Its GAAP profit of $0.70 per share was 1.8% above analysts’ consensus estimates.
Is now the time to buy Barrett? Find out by accessing our full research report, it’s free.
Barrett (BBSI) Q2 CY2025 Highlights:
- Revenue: $307.7 million vs analyst estimates of $300 million (10% year-on-year growth, 2.6% beat)
- EPS (GAAP): $0.70 vs analyst estimates of $0.69 (1.8% beat)
- Adjusted EBITDA: $25.07 million vs analyst estimates of $22.63 million (8.1% margin, 10.8% beat)
- Operating Margin: 7.5%, in line with the same quarter last year
- Market Capitalization: $1.14 billion
“BBSI sustained its positive momentum, delivering another strong quarter of net new client growth,” said Gary Kramer, President and CEO of BBSI.
Company Overview
Operating as a professional employer organization (PEO) that serves over 8,000 companies with more than 120,000 worksite employees, Barrett Business Services (NASDAQ: BBSI) provides management solutions that help small and mid-sized businesses handle human resources, payroll, workers' compensation, and other administrative functions.
Revenue Growth
A company’s long-term sales performance can indicate its overall quality. Any business can put up a good quarter or two, but the best consistently grow over the long haul.
With $1.20 billion in revenue over the past 12 months, Barrett is a small player in the business services space, which sometimes brings disadvantages compared to larger competitors benefiting from economies of scale and numerous distribution channels. On the bright side, it can grow faster because it has more room to expand.
As you can see below, Barrett’s 6.3% annualized revenue growth over the last five years was decent. This shows its offerings generated slightly more demand than the average business services company, a helpful starting point for our analysis.
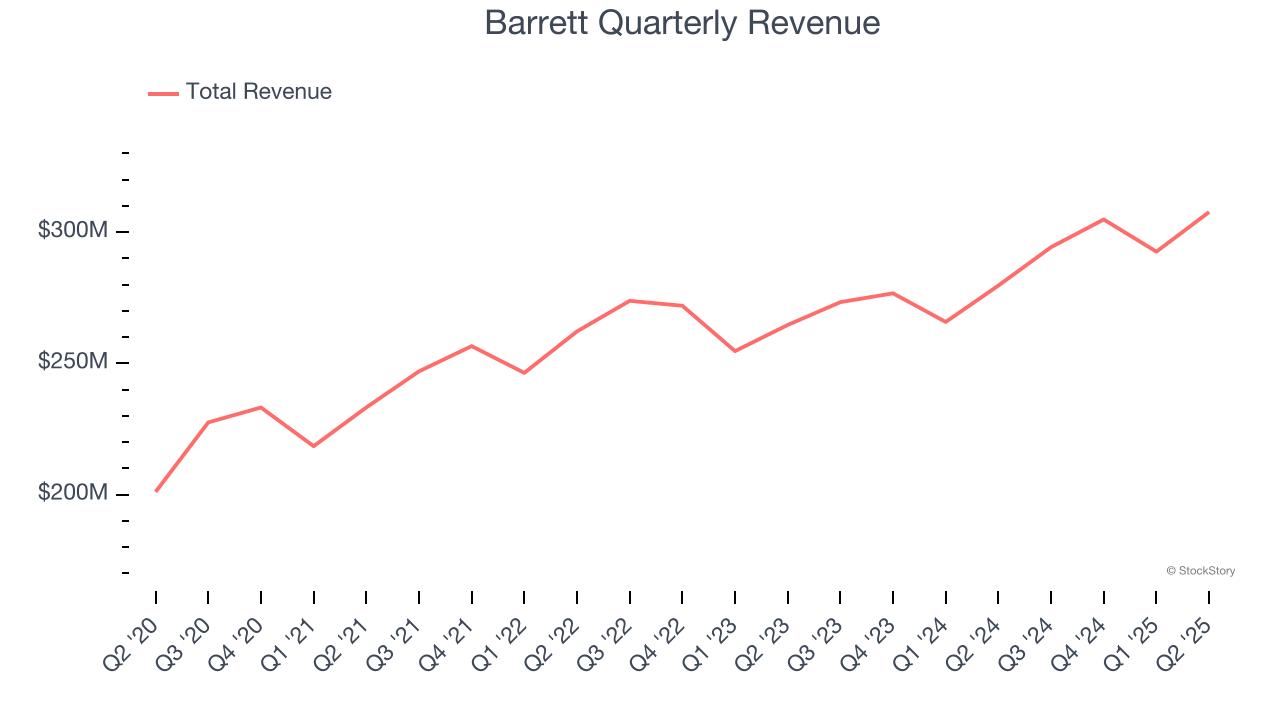
Long-term growth is the most important, but within business services, a half-decade historical view may miss new innovations or demand cycles. Barrett’s annualized revenue growth of 6.1% over the last two years aligns with its five-year trend, suggesting its demand was stable. 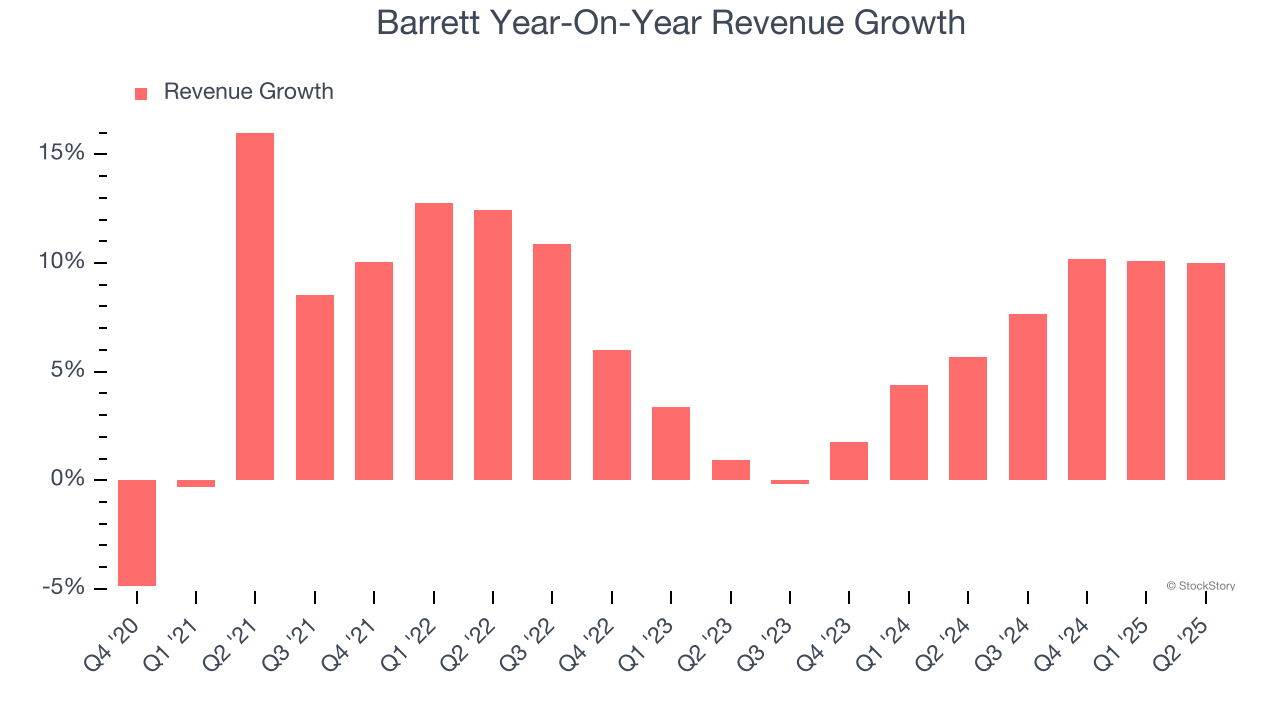
This quarter, Barrett reported year-on-year revenue growth of 10%, and its $307.7 million of revenue exceeded Wall Street’s estimates by 2.6%.
Looking ahead, sell-side analysts expect revenue to grow 6.7% over the next 12 months, similar to its two-year rate. This projection is above average for the sector and implies its newer products and services will help support its recent top-line performance.
Today’s young investors won’t have read the timeless lessons in Gorilla Game: Picking Winners In High Technology because it was written more than 20 years ago when Microsoft and Apple were first establishing their supremacy. But if we apply the same principles, then enterprise software stocks leveraging their own generative AI capabilities may well be the Gorillas of the future. So, in that spirit, we are excited to present our Special Free Report on a profitable, fast-growing enterprise software stock that is already riding the automation wave and looking to catch the generative AI next.
Operating Margin
Barrett’s operating margin might fluctuated slightly over the last 12 months but has remained more or less the same, averaging 5.2% over the last five years. This profitability was lousy for a business services business and caused by its suboptimal cost structure.
Analyzing the trend in its profitability, Barrett’s operating margin might fluctuated slightly but has generally stayed the same over the last five years. This raises questions about the company’s expense base because its revenue growth should have given it leverage on its fixed costs, resulting in better economies of scale and profitability.
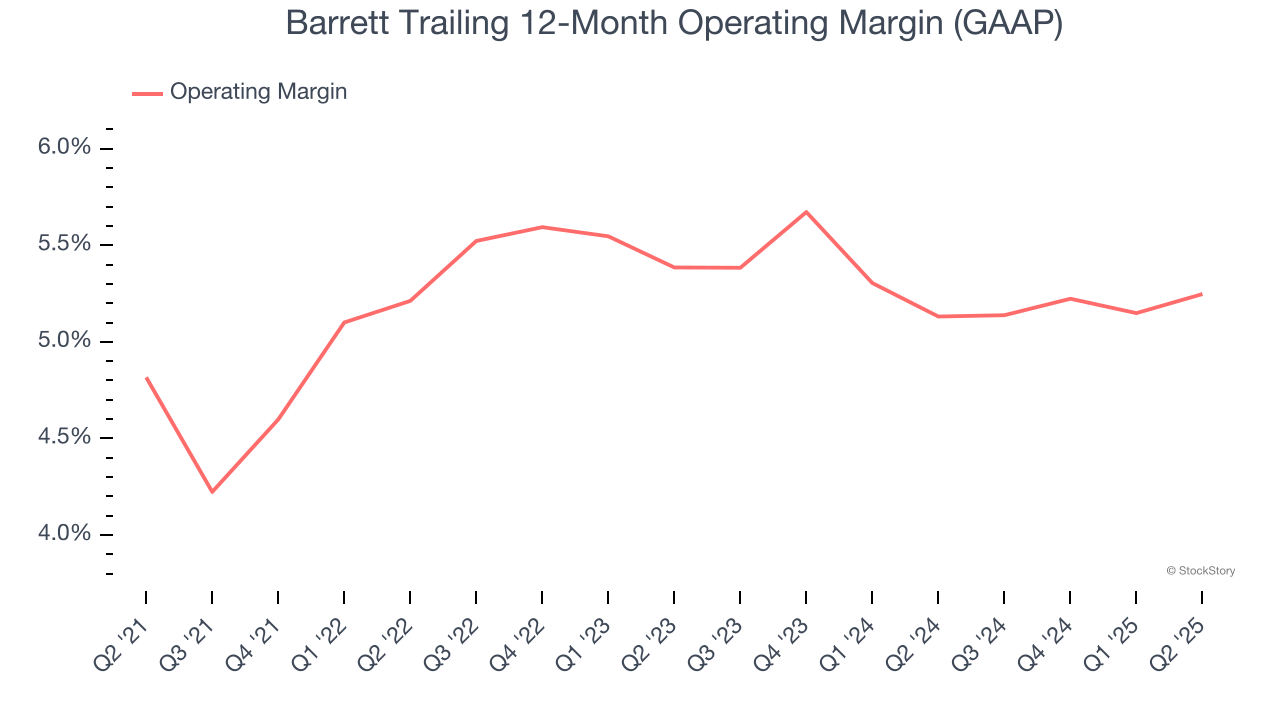
In Q2, Barrett generated an operating margin profit margin of 7.5%, in line with the same quarter last year. This indicates the company’s overall cost structure has been relatively stable.
Earnings Per Share
We track the long-term change in earnings per share (EPS) for the same reason as long-term revenue growth. Compared to revenue, however, EPS highlights whether a company’s growth is profitable.
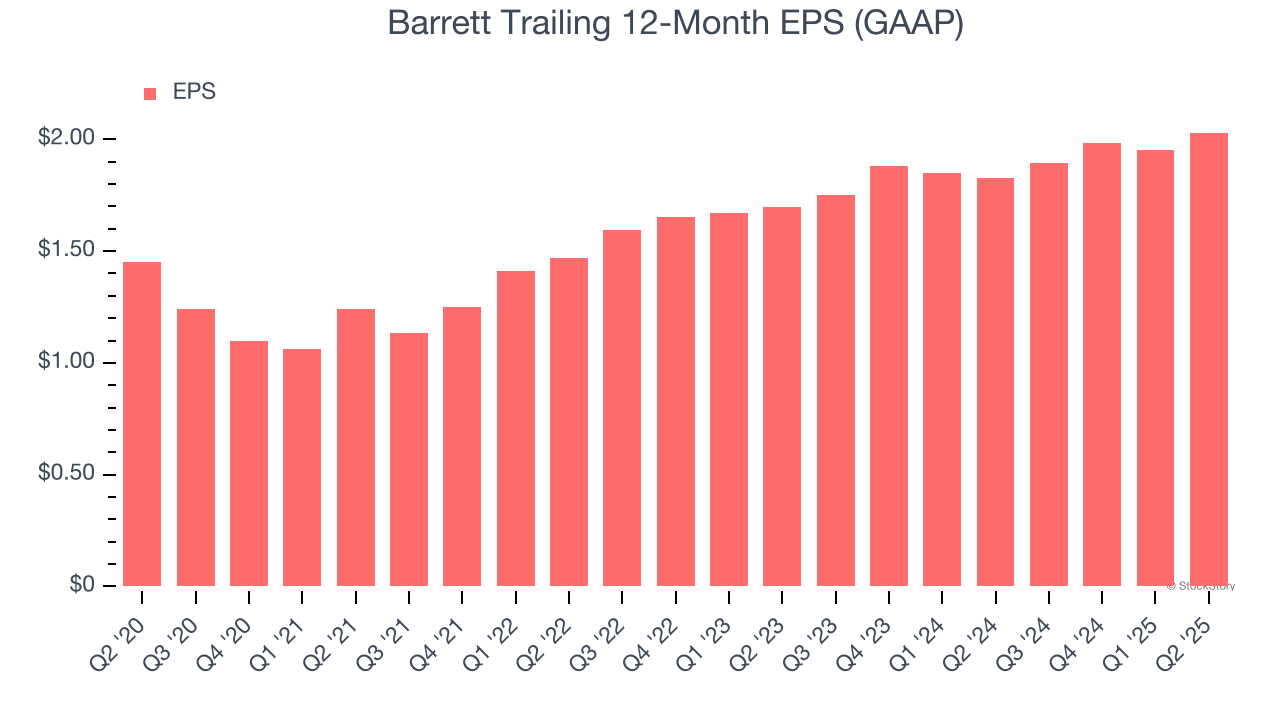
Barrett’s unimpressive 6.9% annual EPS growth over the last five years aligns with its revenue performance. On the bright side, this tells us its incremental sales were profitable.
Like with revenue, we analyze EPS over a shorter period to see if we are missing a change in the business.
Although it wasn’t great, Barrett’s two-year annual EPS growth of 9.4% topped its 6.1% two-year revenue growth.
Diving into the nuances of Barrett’s earnings can give us a better understanding of its performance. A two-year view shows that Barrett has repurchased its stock, shrinking its share count by 4.7%. This tells us its EPS outperformed its revenue not because of increased operational efficiency but financial engineering, as buybacks boost per share earnings. 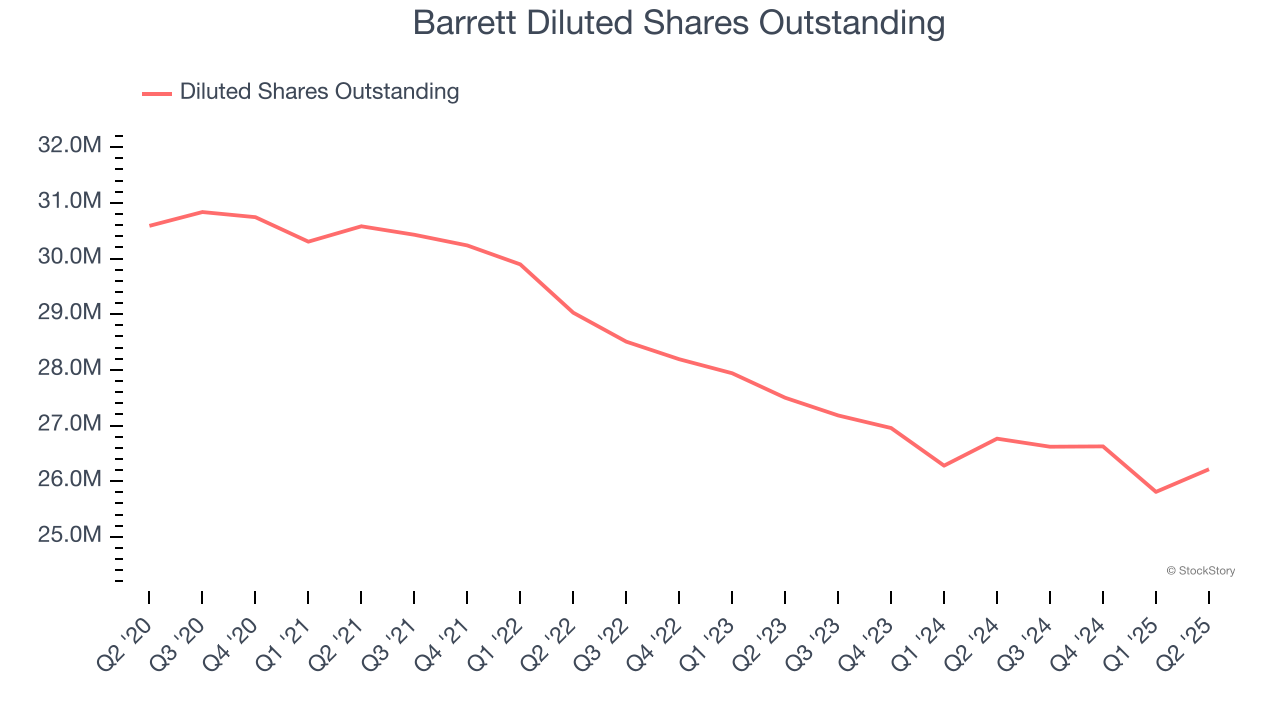
In Q2, Barrett reported EPS at $0.70, up from $0.62 in the same quarter last year. This print beat analysts’ estimates by 1.8%. Over the next 12 months, Wall Street expects Barrett’s full-year EPS of $2.03 to grow 13.8%.
Key Takeaways from Barrett’s Q2 Results
We enjoyed seeing Barrett beat analysts’ revenue expectations this quarter. We were also happy its EPS outperformed Wall Street’s estimates. Overall, this print had some key positives. The stock remained flat at $44.39 immediately following the results.
Is Barrett an attractive investment opportunity right now? When making that decision, it’s important to consider its valuation, business qualities, as well as what has happened in the latest quarter. We cover that in our actionable full research report which you can read here, it’s free.


