

Data storage company NetApp (NASDAQ: NTAP) reported Q2 CY2025 results topping the market’s revenue expectations, with sales up 1.2% year on year to $1.56 billion. The company expects next quarter’s revenue to be around $1.69 billion, close to analysts’ estimates. Its non-GAAP profit of $1.55 per share was 0.7% above analysts’ consensus estimates.
Is now the time to buy NetApp? Find out by accessing our full research report, it’s free.
NetApp (NTAP) Q2 CY2025 Highlights:
- Revenue: $1.56 billion vs analyst estimates of $1.55 billion (1.2% year-on-year growth, 0.9% beat)
- Adjusted EPS: $1.55 vs analyst estimates of $1.54 (0.7% beat)
- The company reconfirmed its revenue guidance for the full year of $6.75 billion at the midpoint
- Management reiterated its full-year Adjusted EPS guidance of $7.75 at the midpoint
- Operating Margin: 19.8%, up from 18.3% in the same quarter last year
- Free Cash Flow Margin: 46.6%, up from 19.5% in the same quarter last year
- Market Capitalization: $21.89 billion
Company Overview
Founded in 1992 as a pioneer in networked storage technology, NetApp (NASDAQ: NTAP) provides data storage and management solutions that help organizations store, protect, and optimize their data across on-premises data centers and public clouds.
Revenue Growth
Examining a company’s long-term performance can provide clues about its quality. Any business can have short-term success, but a top-tier one grows for years.
With $6.59 billion in revenue over the past 12 months, NetApp is one of the larger companies in the business services industry and benefits from a well-known brand that influences purchasing decisions. However, its scale is a double-edged sword because it’s harder to find incremental growth when you’ve penetrated most of the market. To expand meaningfully, NetApp likely needs to tweak its prices, innovate with new offerings, or enter new markets.
As you can see below, NetApp’s sales grew at a tepid 3.8% compounded annual growth rate over the last five years. This shows it failed to generate demand in any major way and is a rough starting point for our analysis.
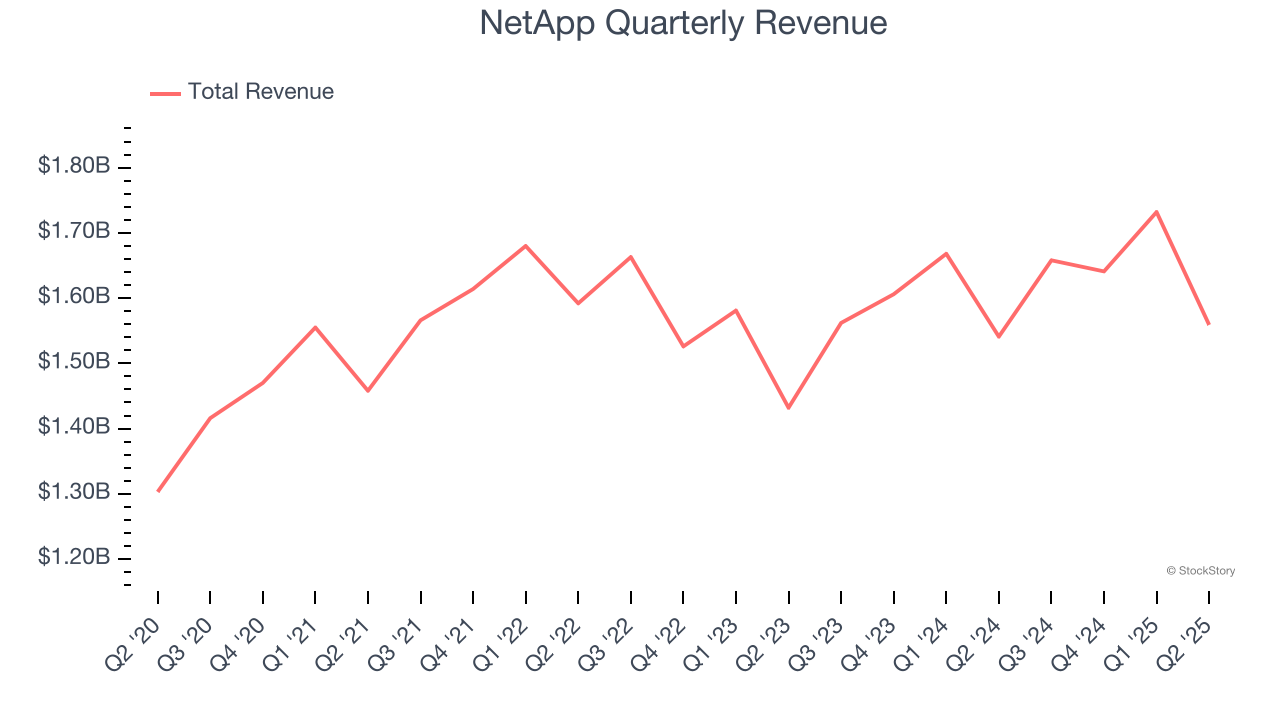
We at StockStory place the most emphasis on long-term growth, but within business services, a half-decade historical view may miss recent innovations or disruptive industry trends. NetApp’s annualized revenue growth of 3.1% over the last two years aligns with its five-year trend, suggesting its demand was consistently weak. 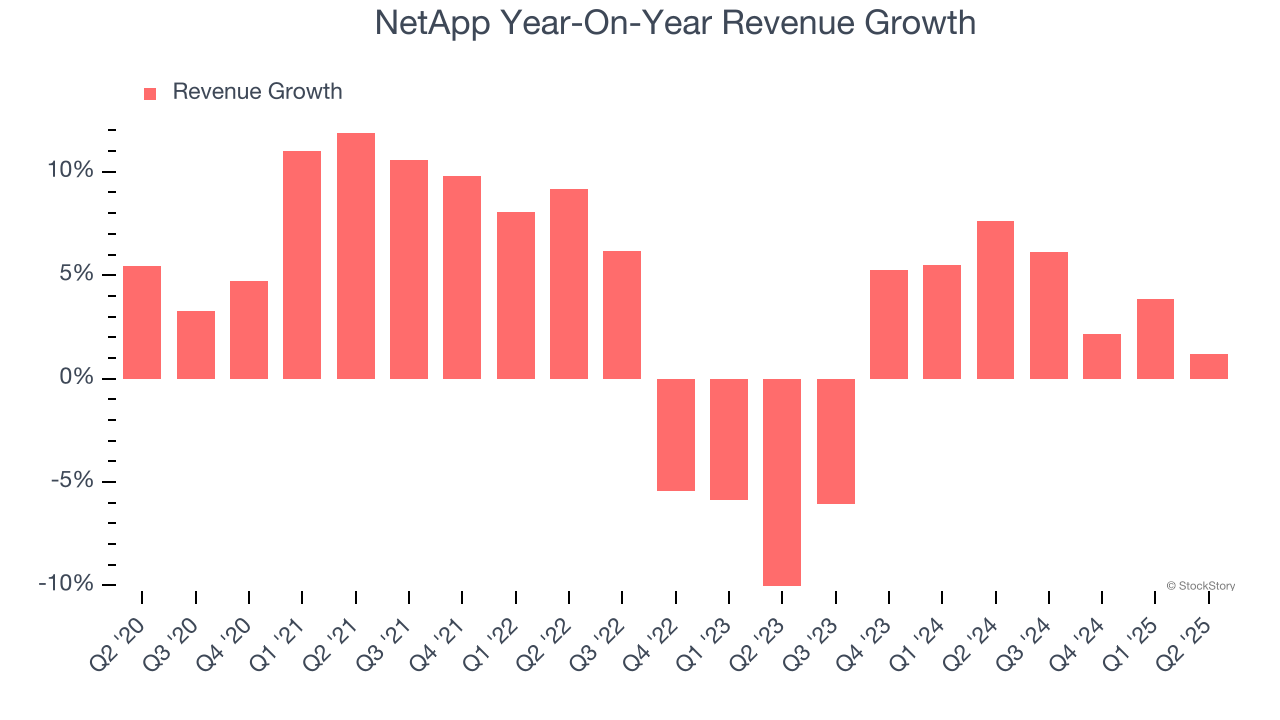
This quarter, NetApp reported modest year-on-year revenue growth of 1.2% but beat Wall Street’s estimates by 0.9%. Company management is currently guiding for a 1.9% year-on-year increase in sales next quarter.
Looking further ahead, sell-side analysts expect revenue to grow 4.2% over the next 12 months, similar to its two-year rate. Although this projection indicates its newer products and services will fuel better top-line performance, it is still below average for the sector.
Unless you’ve been living under a rock, it should be obvious by now that generative AI is going to have a huge impact on how large corporations do business. While Nvidia and AMD are trading close to all-time highs, we prefer a lesser-known (but still profitable) stock benefiting from the rise of AI. Click here to access our free report one of our favorites growth stories.
Operating Margin
NetApp has been a well-oiled machine over the last five years. It demonstrated elite profitability for a business services business, boasting an average operating margin of 18.8%.
Analyzing the trend in its profitability, NetApp’s operating margin rose by 1.3 percentage points over the last five years, as its sales growth gave it operating leverage.
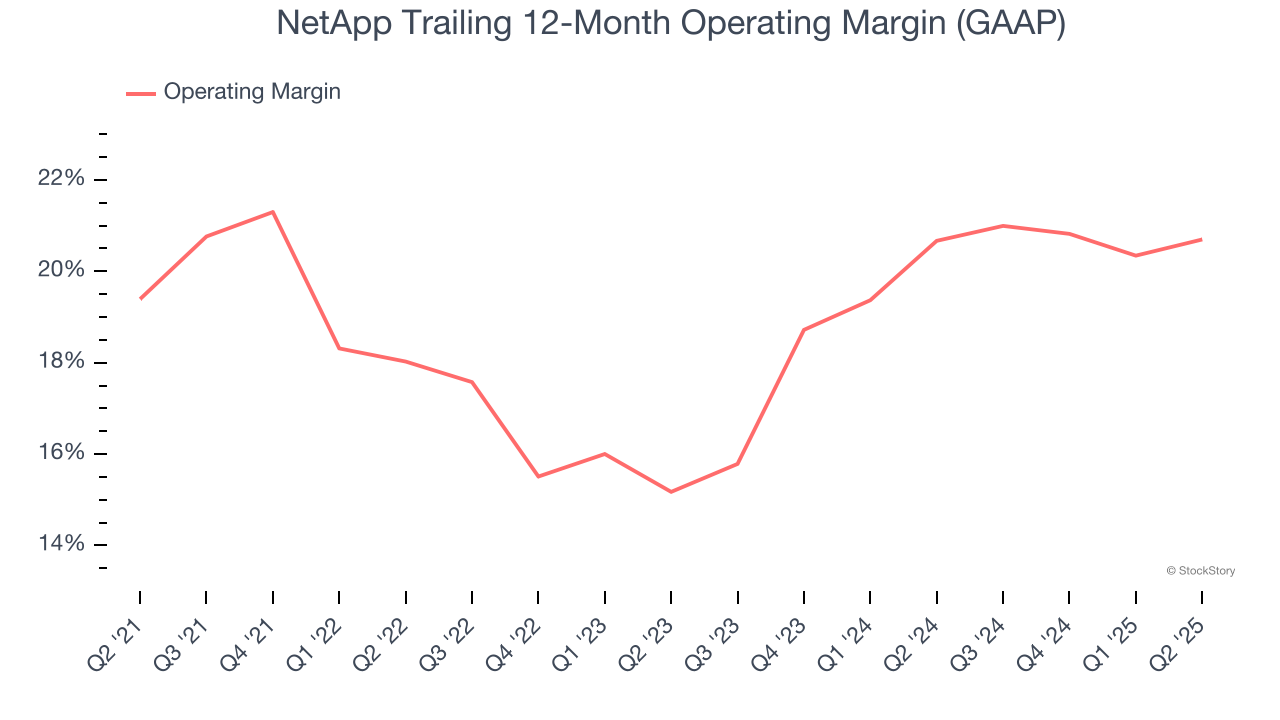
In Q2, NetApp generated an operating margin profit margin of 19.8%, up 1.5 percentage points year on year. This increase was a welcome development and shows it was more efficient.
Earnings Per Share
Revenue trends explain a company’s historical growth, but the long-term change in earnings per share (EPS) points to the profitability of that growth – for example, a company could inflate its sales through excessive spending on advertising and promotions.
NetApp’s EPS grew at a remarkable 11.7% compounded annual growth rate over the last five years, higher than its 3.8% annualized revenue growth. This tells us the company became more profitable on a per-share basis as it expanded.
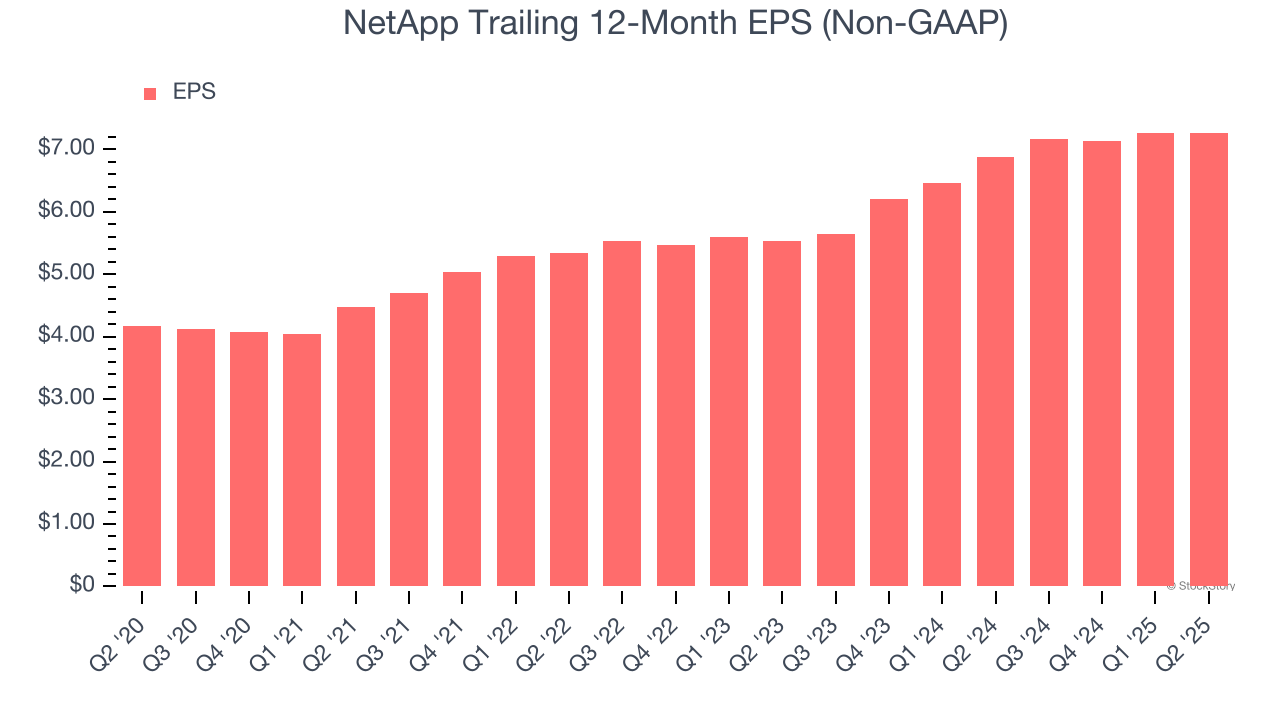
Diving into NetApp’s quality of earnings can give us a better understanding of its performance. As we mentioned earlier, NetApp’s operating margin expanded by 1.3 percentage points over the last five years. On top of that, its share count shrank by 8.6%. These are positive signs for shareholders because improving profitability and share buybacks turbocharge EPS growth relative to revenue growth. 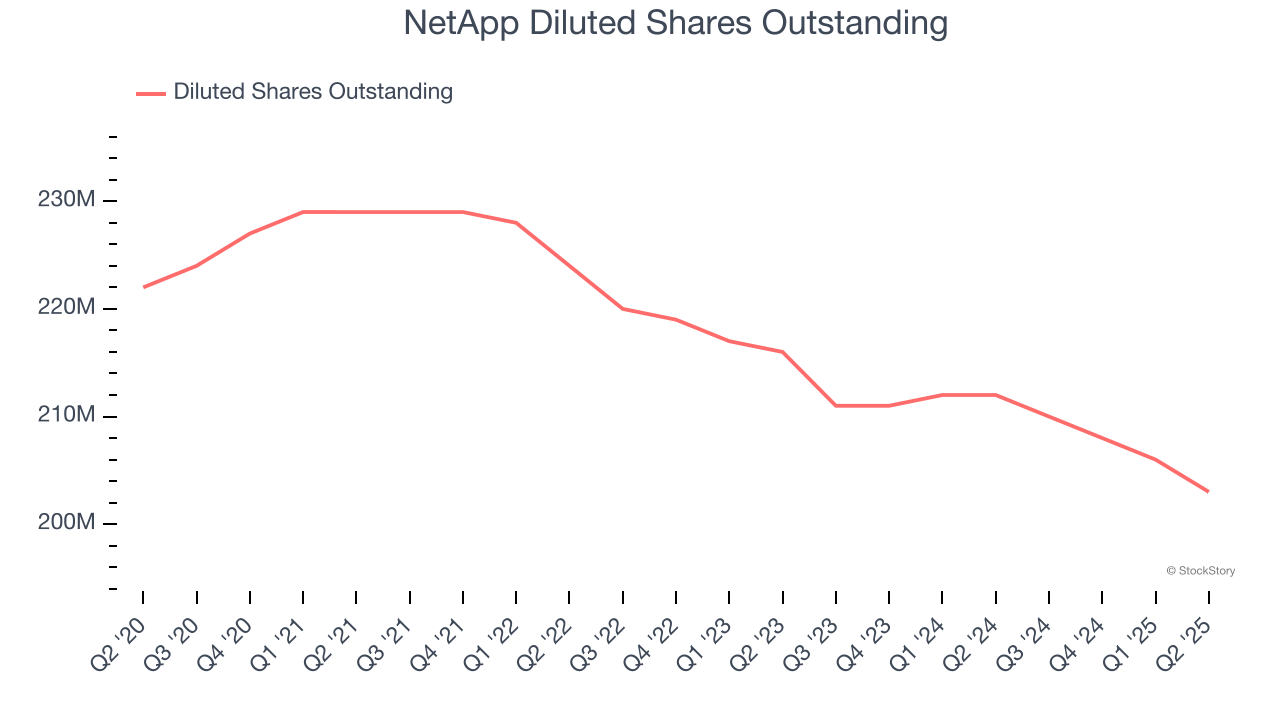
Like with revenue, we analyze EPS over a shorter period to see if we are missing a change in the business.
For NetApp, its two-year annual EPS growth of 14.5% was higher than its five-year trend. We love it when earnings growth accelerates, especially when it accelerates off an already high base.
In Q2, NetApp reported adjusted EPS of $1.55, down from $1.56 in the same quarter last year. This print was close to analysts’ estimates. Over the next 12 months, Wall Street expects NetApp’s full-year EPS of $7.26 to grow 10.5%.
Key Takeaways from NetApp’s Q2 Results
It was good to see NetApp narrowly top analysts’ revenue expectations this quarter. We were also happy its EPS guidance for next quarter narrowly outperformed Wall Street’s estimates. On the other hand, its full-year revenue guidance was in line. Zooming out, we think this was a mixed quarter. Investors were likely hoping for more, and shares traded down 5.8% to $105.60 immediately after reporting.
Should you buy the stock or not? If you’re making that decision, you should consider the bigger picture of valuation, business qualities, as well as the latest earnings. We cover that in our actionable full research report which you can read here, it’s free.


