Automotive manufacturer Ford (NYSE: F) announced better-than-expected revenue in Q3 CY2025, with sales up 9.4% year on year to $50.53 billion. Its non-GAAP profit of $0.45 per share was 25.4% above analysts’ consensus estimates.
Is now the time to buy Ford? Find out by accessing our full research report, it’s free for active Edge members.
Ford (F) Q3 CY2025 Highlights:
- Revenue: $50.53 billion vs analyst estimates of $46.33 billion (9.4% year-on-year growth, 9.1% beat)
- Adjusted EPS: $0.45 vs analyst estimates of $0.36 (25.4% beat)
- Operating Margin: 3.1%, up from 1.9% in the same quarter last year
- Free Cash Flow Margin: 10.4%, up from 7.6% in the same quarter last year
- Sales Volumes rose 5.6% year on year (0.8% in the same quarter last year)
- Market Capitalization: $49.47 billion
Company Overview
Established to make automobiles accessible to a broader segment of the population, Ford (NYSE: F) designs, manufactures, and sells a variety of automobiles, trucks, and electric vehicles.
Revenue Growth
A company’s long-term performance is an indicator of its overall quality. Even a bad business can shine for one or two quarters, but a top-tier one grows for years. Luckily, Ford’s sales grew at a decent 7.7% compounded annual growth rate over the last five years. Its growth was slightly above the average industrials company and shows its offerings resonate with customers.
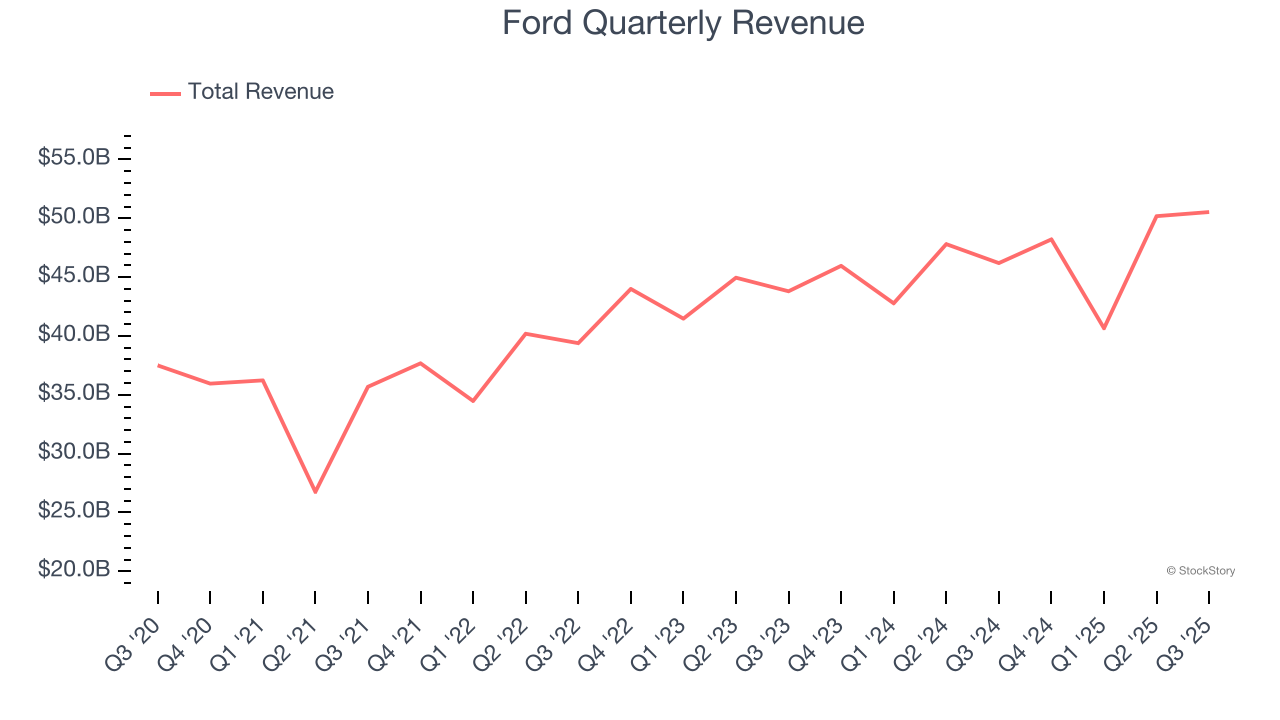
Long-term growth is the most important, but within industrials, a half-decade historical view may miss new industry trends or demand cycles. Ford’s recent performance shows its demand has slowed as its annualized revenue growth of 4.3% over the last two years was below its five-year trend. 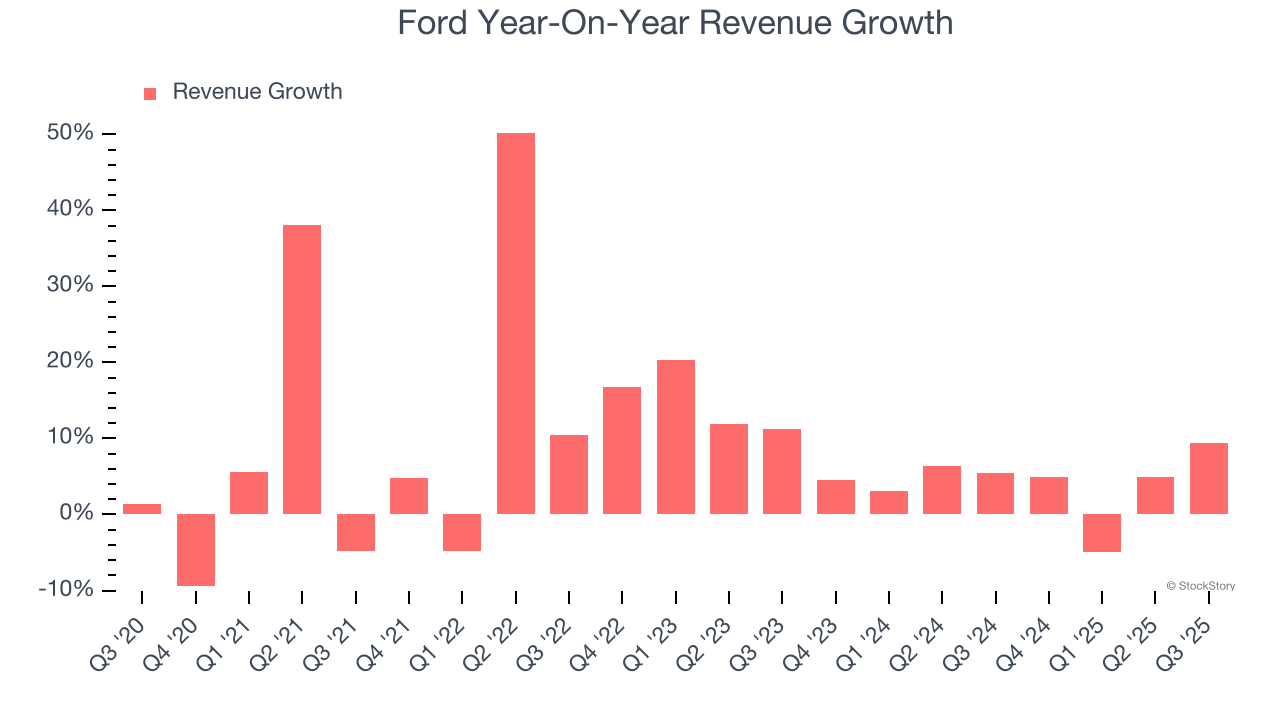
We can dig further into the company’s revenue dynamics by analyzing its number of vehicles sold, which reached 1.16 million in the latest quarter. Over the last two years, Ford’s vehicles sold were flat. Because this number is lower than its revenue growth, we can see the company benefited from price increases. 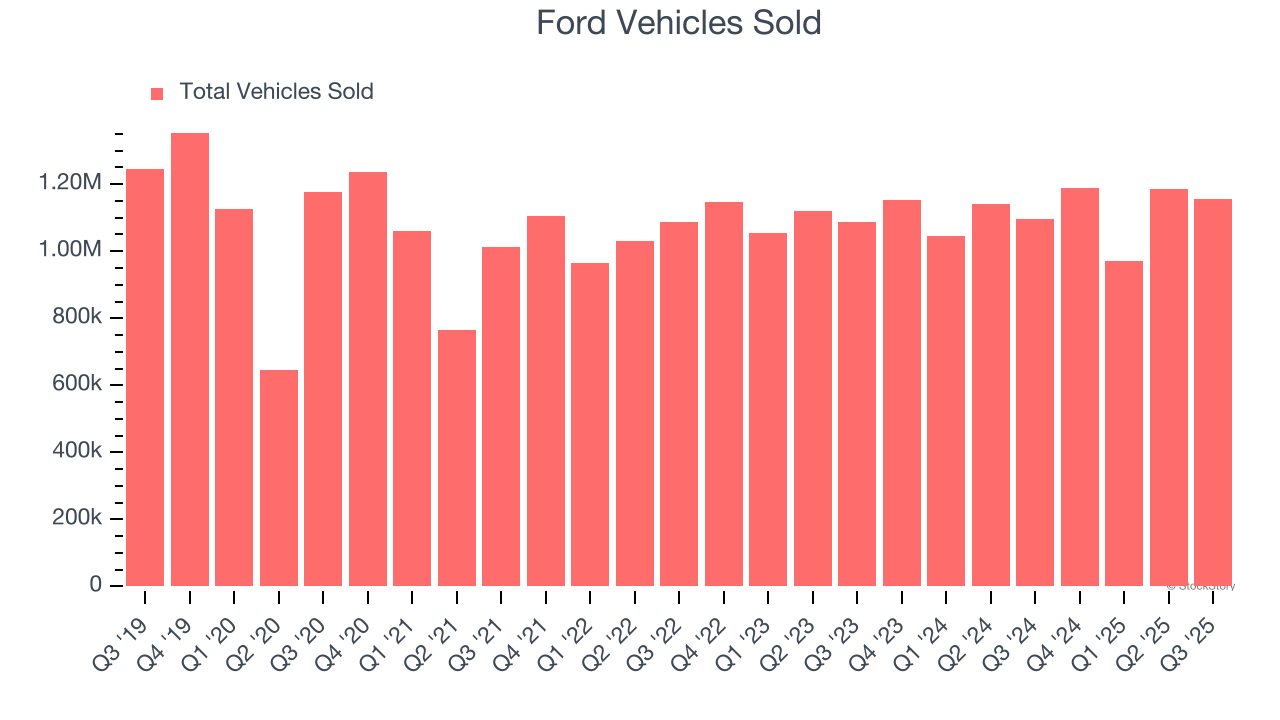
This quarter, Ford reported year-on-year revenue growth of 9.4%, and its $50.53 billion of revenue exceeded Wall Street’s estimates by 9.1%.
Looking ahead, sell-side analysts expect revenue to decline by 3.9% over the next 12 months, a deceleration versus the last two years. This projection is underwhelming and suggests its products and services will face some demand challenges.
Today’s young investors won’t have read the timeless lessons in Gorilla Game: Picking Winners In High Technology because it was written more than 20 years ago when Microsoft and Apple were first establishing their supremacy. But if we apply the same principles, then enterprise software stocks leveraging their own generative AI capabilities may well be the Gorillas of the future. So, in that spirit, we are excited to present our Special Free Report on a profitable, fast-growing enterprise software stock that is already riding the automation wave and looking to catch the generative AI next.
Operating Margin
Operating margin is an important measure of profitability as it shows the portion of revenue left after accounting for all core expenses – everything from the cost of goods sold to advertising and wages. It’s also useful for comparing profitability across companies with different levels of debt and tax rates because it excludes interest and taxes.
Ford’s operating margin might fluctuated slightly over the last 12 months but has remained more or less the same, averaging 2.6% over the last five years. This profitability was lousy for an industrials business and caused by its suboptimal cost structureand low gross margin.
Looking at the trend in its profitability, Ford’s operating margin might fluctuated slightly but has generally stayed the same over the last five years. This raises questions about the company’s expense base because its revenue growth should have given it leverage on its fixed costs, resulting in better economies of scale and profitability.
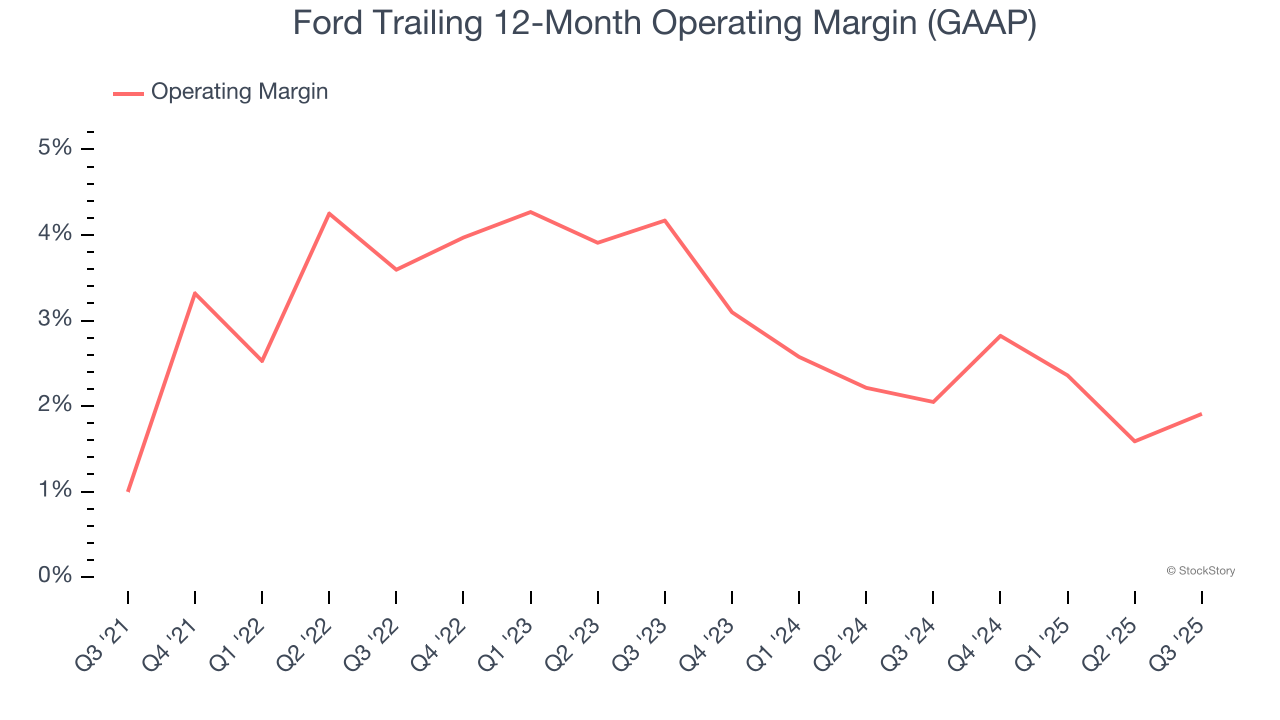
This quarter, Ford generated an operating margin profit margin of 3.1%, up 1.2 percentage points year on year. Since its gross margin expanded more than its operating margin, we can infer that leverage on its cost of sales was the primary driver behind the recently higher efficiency.
Earnings Per Share
Revenue trends explain a company’s historical growth, but the long-term change in earnings per share (EPS) points to the profitability of that growth – for example, a company could inflate its sales through excessive spending on advertising and promotions.
Ford’s EPS grew at an astounding 48% compounded annual growth rate over the last five years, higher than its 7.7% annualized revenue growth. However, we take this with a grain of salt because its operating margin didn’t improve and it didn’t repurchase its shares, meaning the delta came from reduced interest expenses or taxes.
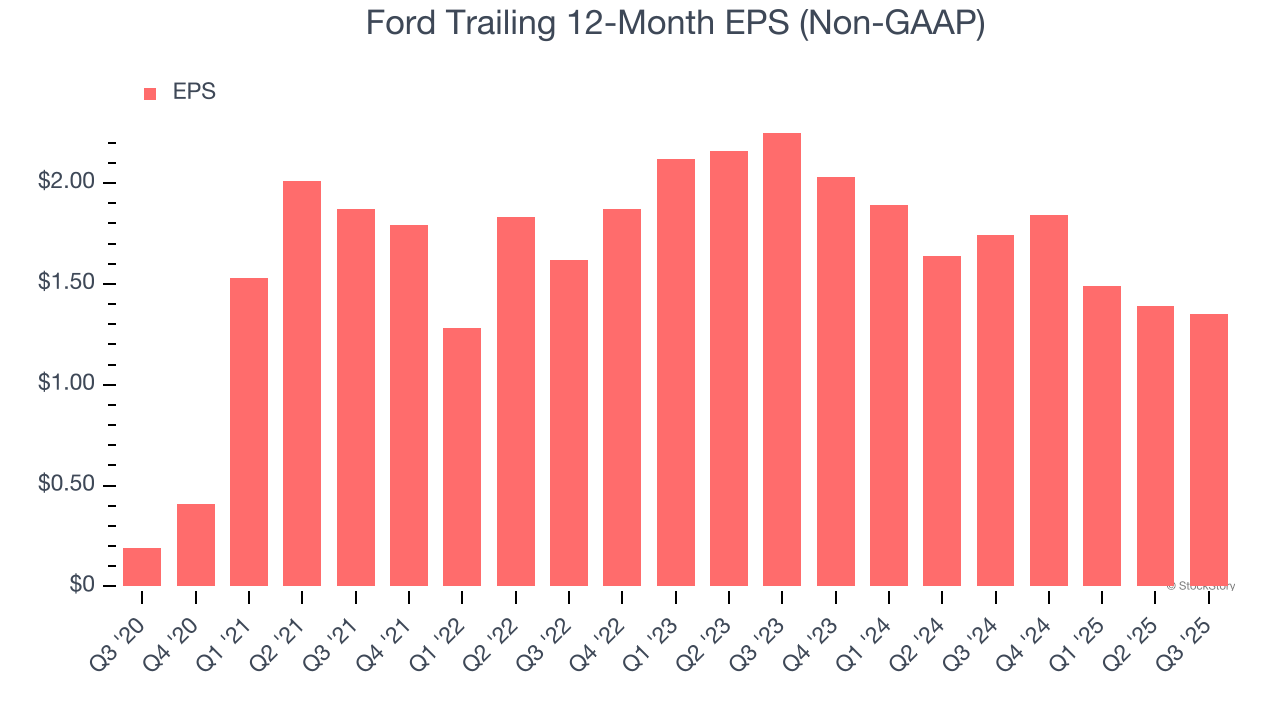
Like with revenue, we analyze EPS over a shorter period to see if we are missing a change in the business.
For Ford, its two-year annual EPS declines of 22.5% mark a reversal from its (seemingly) healthy five-year trend. We hope Ford can return to earnings growth in the future.
In Q3, Ford reported adjusted EPS of $0.45, down from $0.49 in the same quarter last year. Despite falling year on year, this print easily cleared analysts’ estimates. Over the next 12 months, Wall Street expects Ford’s full-year EPS of $1.35 to stay about the same.
Key Takeaways from Ford’s Q3 Results
It was good to see Ford beat analysts’ EPS expectations this quarter. We were also excited its revenue outperformed Wall Street’s estimates by a wide margin. Zooming out, we think this quarter featured some important positives. The stock traded up 3.7% to $12.77 immediately after reporting.
Ford may have had a good quarter, but does that mean you should invest right now? When making that decision, it’s important to consider its valuation, business qualities, as well as what has happened in the latest quarter. We cover that in our actionable full research report which you can read here, it’s free for active Edge members.