During uncertain macroeconomic times, consumers trying to stretch their budgets will migrate towards finding promotions and discounts at retailers. Consumers shop in dollar stores to get the best deals. This would lead investors to believe they are performing with or better than the benchmark indices, but that is not always the case. In the current environment, the dollar store stocks are vastly underperforming the S&P 500 index.
These stocks are still sliding and getting even more affordable. Investors still looking to get in on the dollar store stocks can consider watching these 2 stocks as their dollar store empires fall into value territory.
Dollar Tree Inc. (NASDAQ: DLTR)
Dollar Tree is the largest “true” dollar store operator in the U.S., with over 16,000 locations selling under the Dollar Tree and Family Dollar brands. The theme of both brands is that they sell items priced at $1 or less. In reality, Dollar Tree has raised prices to $1.25 or less, but the company recently announced rolling prices back to $1 on 300 to 400 products.
However, they will also roll out a mix of items priced at $3 to $5. Items range from household goods to food to home décor, electronics, health and beauty products, toys, craft supplies, pet supplies and seasonal items. DLTR shares are trading down 12% year-to-date (YTD) and at 12.6X forward earnings.
Strong Q3 2023 Earnings
On Aug. 24, 2023, Dollar Tree released its Q2 2023 earnings report for the quarter ending July 2023. The company reported EPS of 91 cents versus 87 cents consensus analyst estimate, a 4-cent beat. Revenues grew 8.2% YoY to $7.32 billion versus $7.18 billion. Same-store sales rose 7.8% for Dollar Tree and 5.8% for Family Dollar.
Dollar Tree saw NYSE: DKS">shrink (theft) rise from 55 bps in Q1 2023 sequentially to 75 bps in Q2 2023. Family Dollar experienced a shrink drop from 60 bps to 45 bps YoY change.
Mixed Guidance
Dollar Tree provided mixed guidance for Q3 2023. It lowered EPS guidance to 94 cents to $1.04 versus the $1.27 consensus analyst estimate. Revenues are expected between $7.3 billion to $7.5 billion versus $7.3 billion. This outlook is based on a mid-single-digit increase in same-store sales for both brands.
For the full year 2023, Dollar Tree expects EPS between $5.78 to $6.03 versus $6.03 analyst estimates. The EPS outlook includes a 12-cent charge ($30 million) for the legal reserve taken during its Q1 and the impact of a 53rd week in fiscal 2023. It expects higher revenues of $30.6 billion to $30.9 billion versus $30.42 billion analyst estimates.
The company expects a $1 per share benefit from reduced freight expenses in the second half of 2023. DLTR shares tumbled 13% on the guidance.
Dollar Tree analyst ratings and price targets are at MarketBeat.
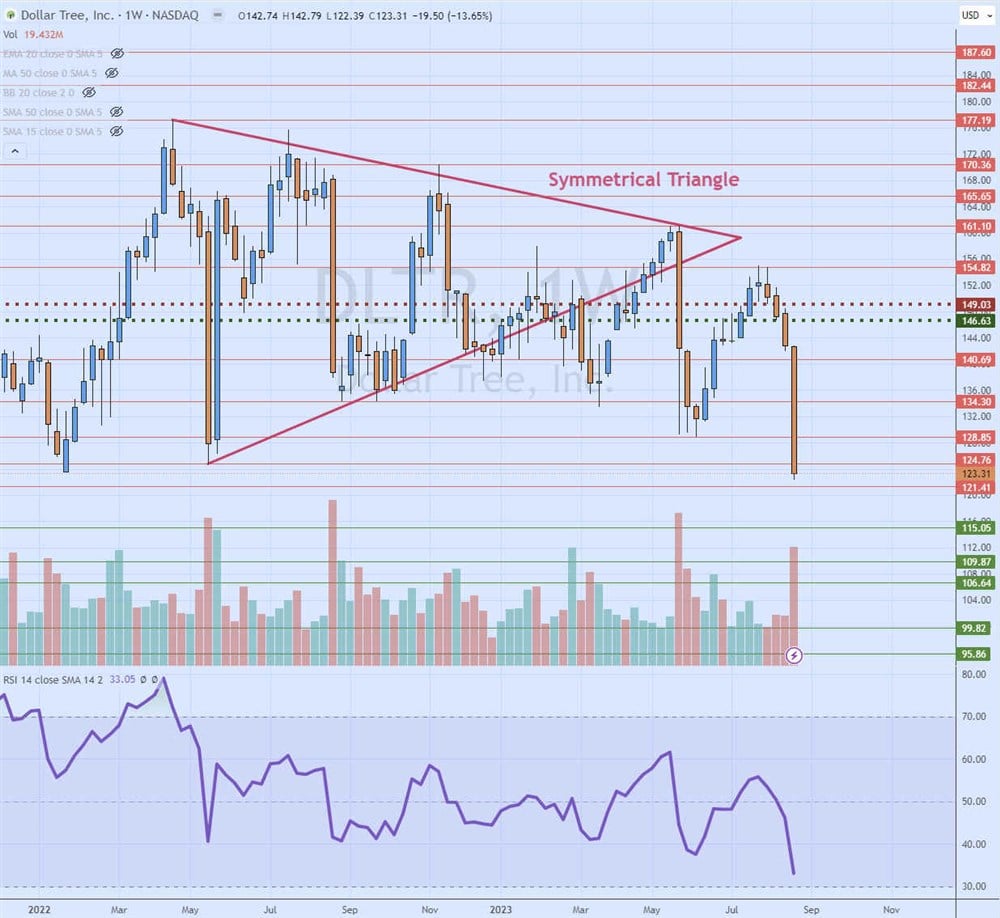
Weekly Symmetrical Triangle Breakdown
DLTR formed a weekly symmetrical triangle starting at a $177.19 peak in April 2022, falling to a lower of $124.76 in May 2022. Each successive price bounce was met with selling at lower highs, and each successive price drop was met with buying at high prices. This formed a descending upper trendline and a rising lower trendline.
DLTR triggered a market structure low (MSL) trigger long above the $146.63 level to peak at $161.10 before collapsing through the higher lower trendline. Its earnings news dropped shares another 13% on the guidance as shares fell under its previous $124.76 swing low. The relative strength index (RSI) falls towards the oversold 30 band.
Pullback support levels are at $121.51, $115.05, $109.87 and $106.64.
Dollar General Inc. (NYSE: DG)
While Dollar General sounds like it would be a dollar store, it's just a deep discount little big box variety store. While it does have a selection of 2,000 items selling for $1 or less, most items are discounted to sell for under $10. Very few items are priced above $20. It's the largest discount retailer in the country, with over 19,200 stores.
The strategy with Dollar General is to open up discount variety stores in rural towns of less than 20,000 resident populations filled with items you would normally find in a big box retailer like Target Co. (NYSE: TGT) or Walmart Inc. (NYSE: WMT) but in a smaller space.
Since the big box retailers wouldn't even think of building a store in these towns, Dollar General ends up having a lock on the location as the most economical option for shoppers on a budget or trading down. This big fish in a small pond strategy has helped Dollar General grow its brand and store count with no threat from the big box stores.
Dollar General has low prices but doesn't price its items for $1 or less. However, its performance has been plagued by missed and lowered guidance estimates, causing shares to trade down a whopping 37% YTD, trading at 15.4X forward earnings.
Swing and Missing
Dollar General reported its Q1 2023 earnings for the quarter ending April 2023 on June 1, 2023. The company had EPS of $2.34, missing analyst estimates of $2.38 by 4 cents. Revenues rose 6.8% YoY to $9.34 billion, falling short of $9.47 billion consensus estimates. Same-store sales rose 1.6% YoY.
Downside Guidance
Dollar General lowered its full-year 2023 guidance with EPS flat to down 8% YoY between $9.79 to $10.68 versus $11.23 consensus analyst estimates. Full-year 2023 revenues are projected between $39.2 billion and $39.7 billion, falling short of $40.7 billion consensus analyst estimates.
Same-store sales are expected between 1% to 2%, lowered from 3% to 3.5% previously forecasted. The company cites a challenging macroeconomic environment for the lowered guidance.
Dollar General analyst ratings and price targets are at MarketBeat.
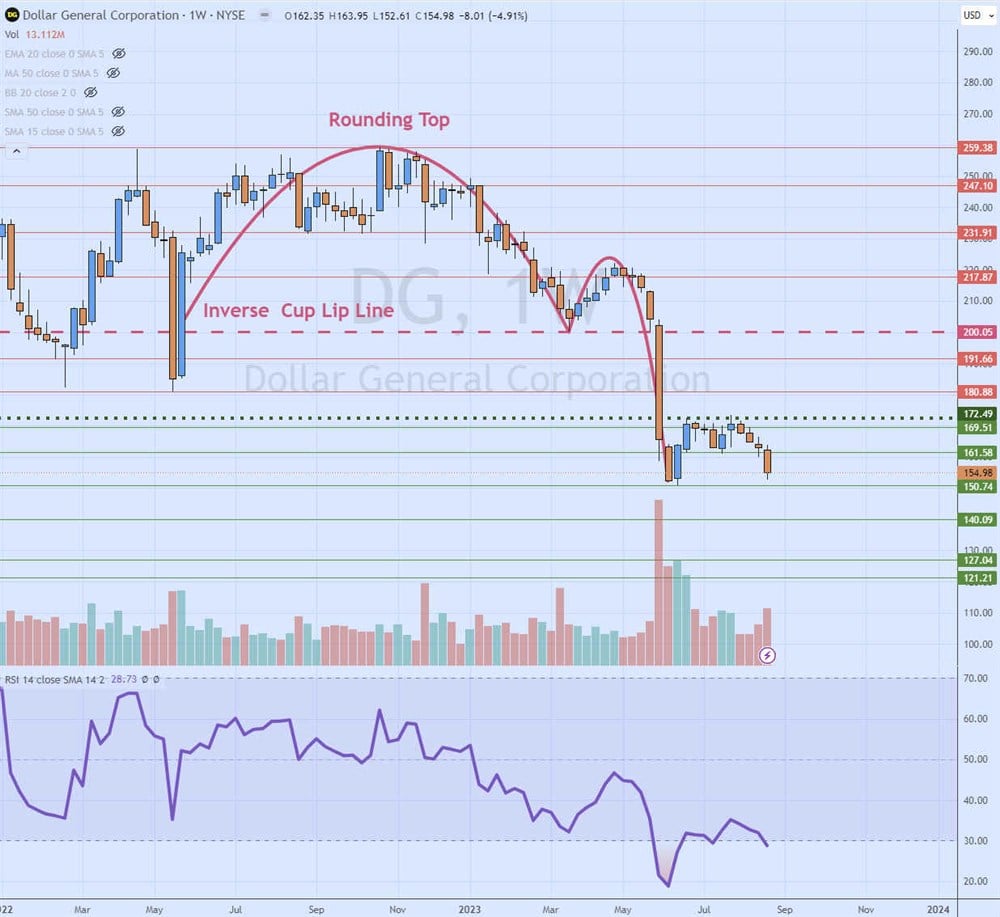
Weekly Inverse Cup and Handle Breakdown
The weekly chart on DG shows an inverted cup and handle breakdown. The inverse cup lip line at $200.50 was made in May 2022. Shares rose to $259.38 highs by October 2022 as a rounding top formed. DG tested the $200.05 lip line before coiling to form a handle upon peaking at $222.21 in May 2023.
Shares collapsed through the cup lip line to hit a swing low of $150.74 in June 2023 as the relative strength index (RSI) oscillator fell under the 30-band oversold territory. The weekly market structure low (MSL) trigger formed at $172.49, which DG still couldn't trigger as shares fell, taking the RSI back down under the 30-band. Pullback support levels are $150.74, $140.09, $127.04 and $121.24.