DALLAS, Aug. 21, 2025 (GLOBE NEWSWIRE) -- Texas new home sales decreased in July, continuing last month’s decline as Ben Caballero predicted when he said, “Texas 2025 new home sales likely peaked in May.” The latest Texas New Home Sales Report was released today by HomesUSA.com and its founder and CEO, Ben Caballero, the nation’s top-ranked real estate agent.

The HomesUSA.com New Home Sales Report uses Multiple Listing Service data – the most comprehensive, current, and accurate information – from the REALTOR® Associations of North Texas, Houston, Austin, and San Antonio. All averages are based on three-month rolling averages to capture seasonality and remove anomalies.
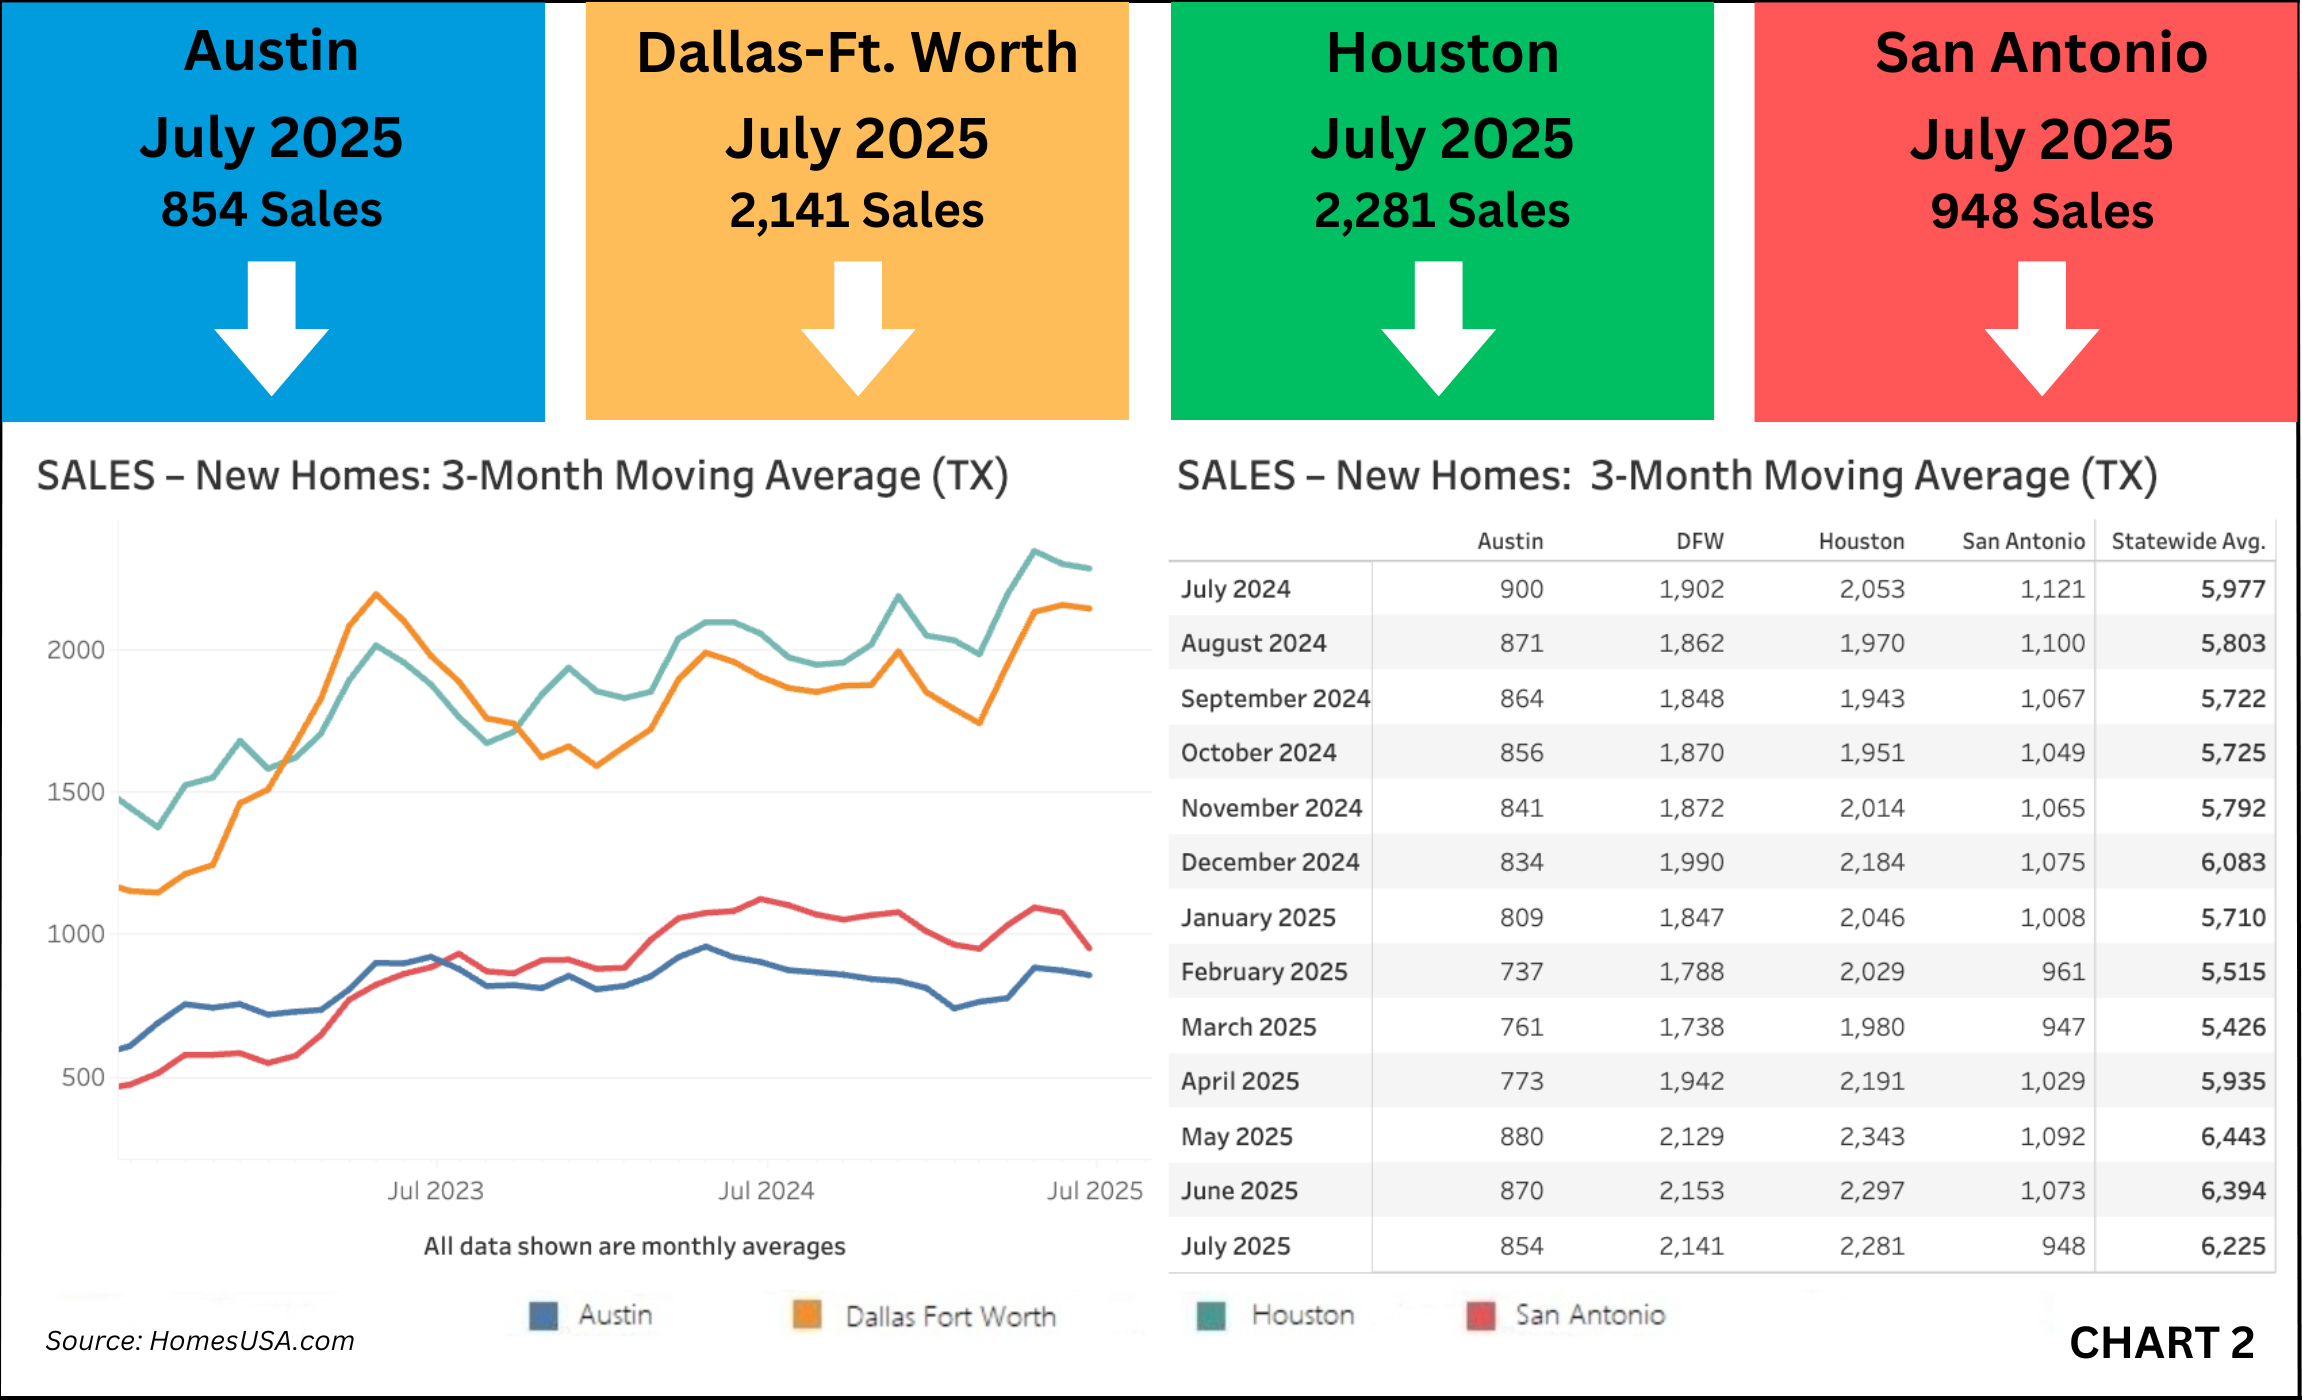
Texas new home sales decreased in July to 6,225 sales from 6,394 in June. Houston sales declined to 2,281 from 2,297 the prior month. Dallas-Ft. Worth posted 2,141 sales, down from 2,153 in June, while Austin dropped to 854 from 870. San Antonio recorded the steepest monthly drop, falling to 948 sales from 1,073 in June.
"Sales slowed in July as I predicted, and Texas builders are sitting on the deepest bench of inventory we’ve seen in more than a year," said Ben Caballero, CEO of HomesUSA.com. "If mortgage rates blink, they’re ready to move the ball downfield – fast."
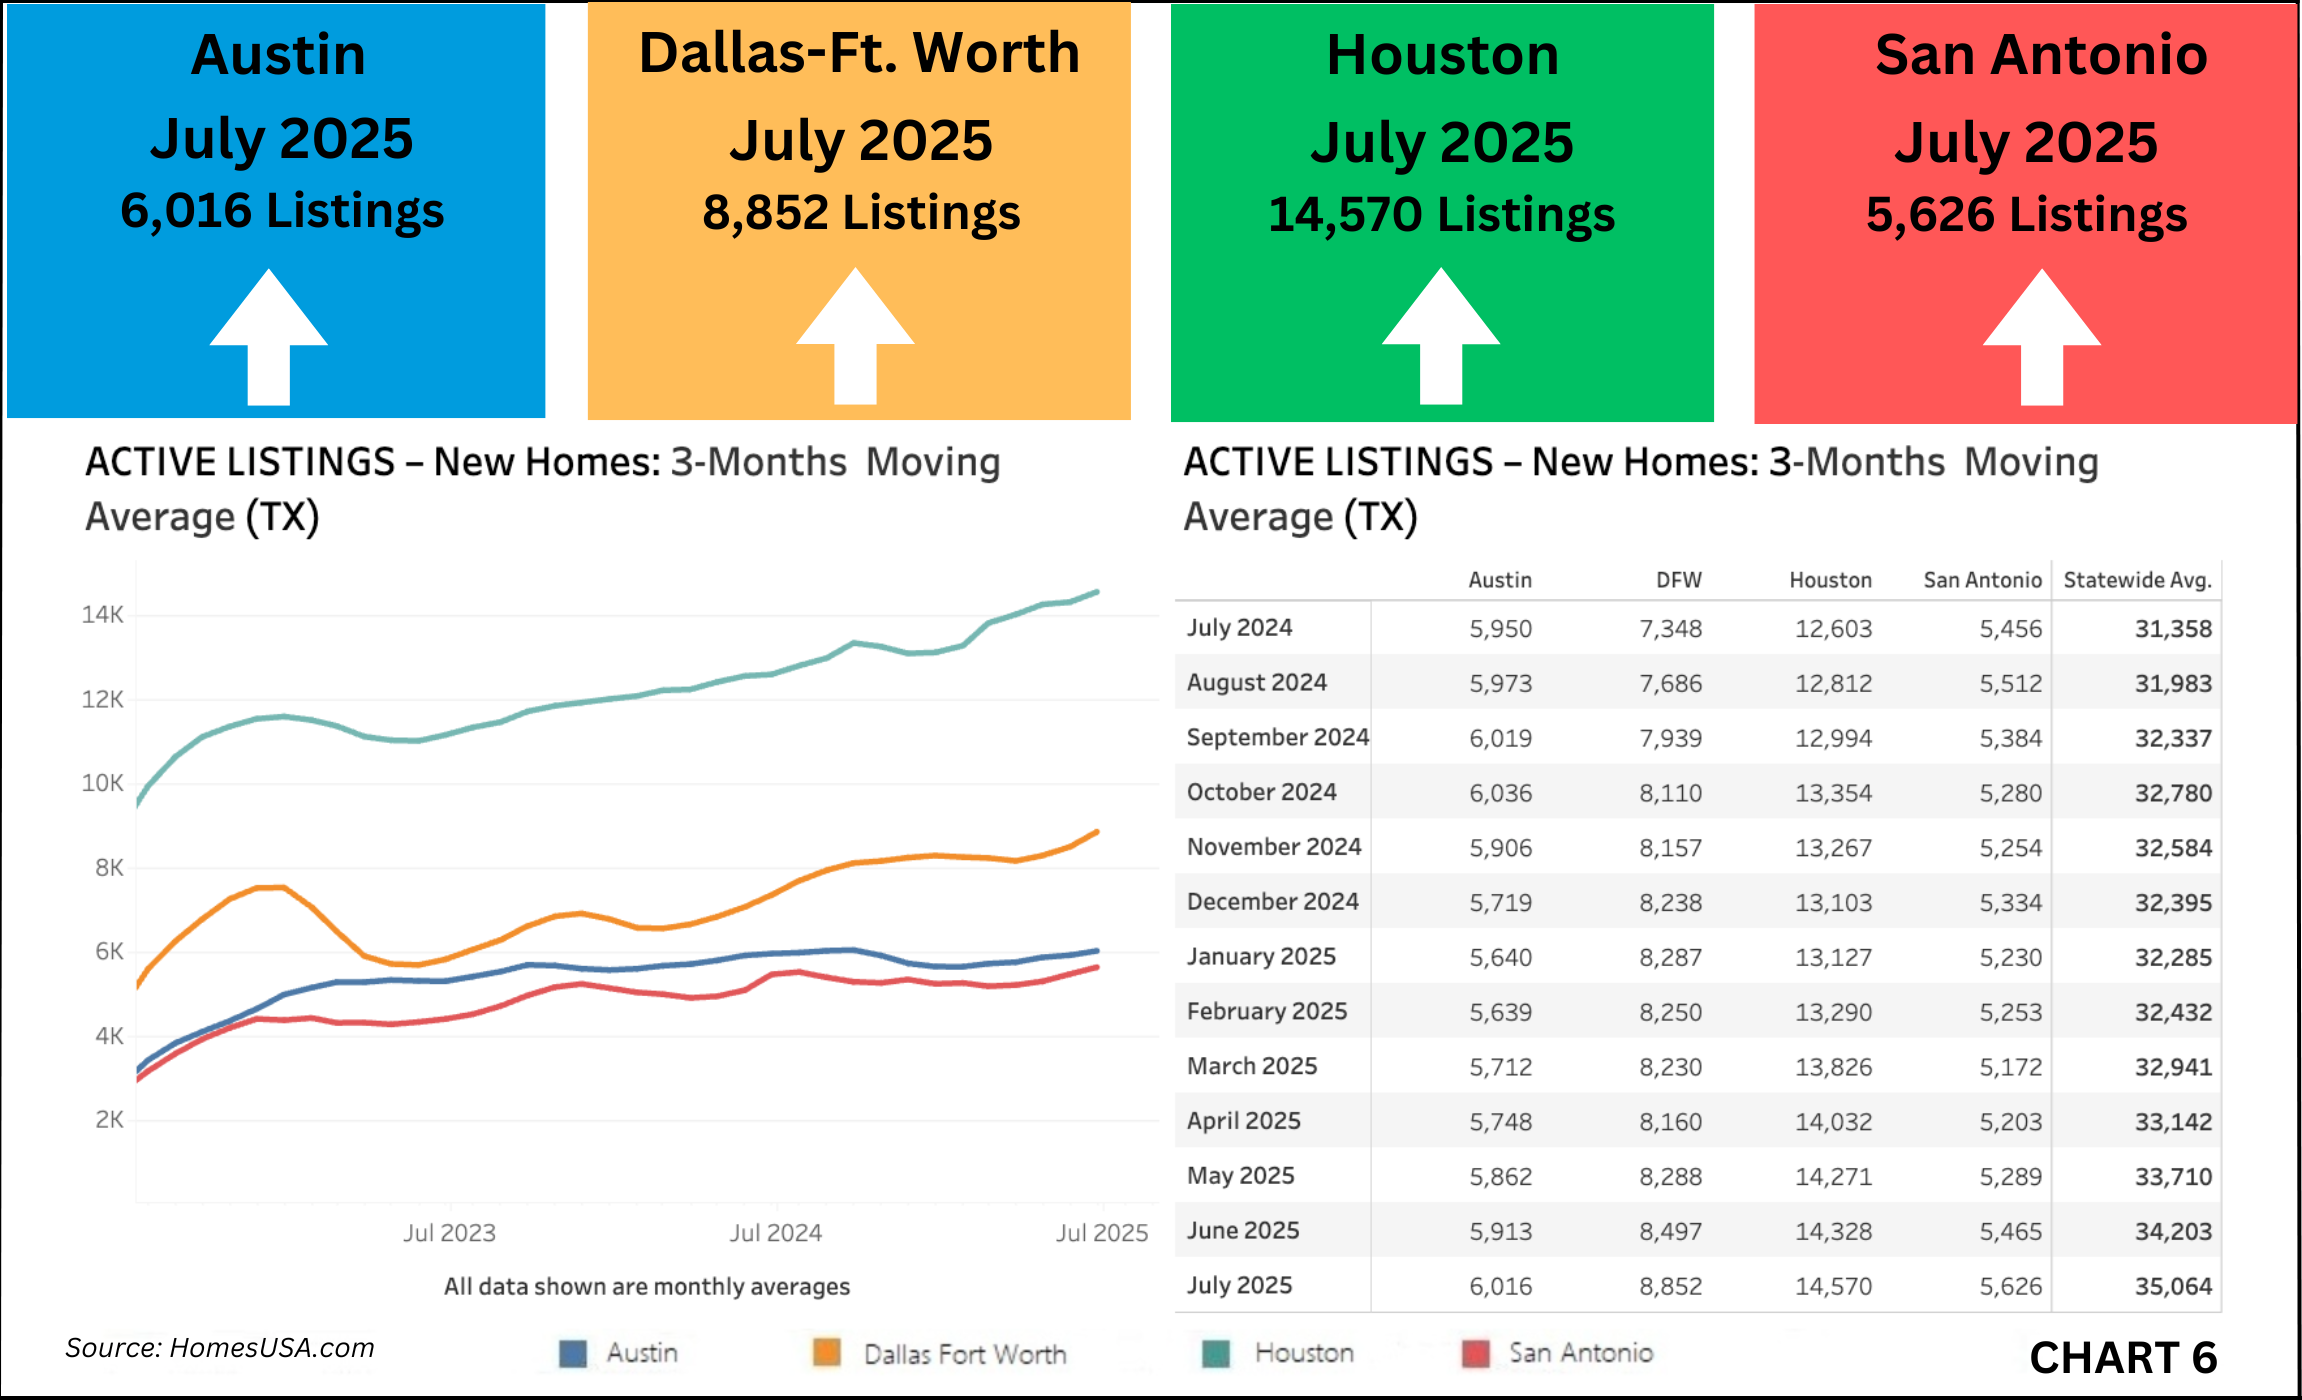
Active new home listings statewide climbed to a record 35,064 in July, up from 34,203 in June. It was the highest total of active listings since HomesUSA.com began tracking monthly data in November 2017. Houston led with 14,570 listings, rising from 14,328. Dallas-Ft. Worth saw the biggest month-over-month jump, increasing to 8,852 from 8,497. Austin’s inventory grew to 6,016 from 5,913, and San Antonio rose to 5,626 from 5,465.
“Two facts to consider about the new home inventory. First, it is higher than the reported numbers because builders do not list all their homes in MLS. Second, not all new homes listed in MLS are complete. If you take the total Texas numbers at face value, there is over 5 months of new home inventory, which is approaching a concerning level,” added Caballero
"Houston builders remain the most aggressive in expanding their inventory – now at the highest level we’ve seen in recent years. But they’ve done that in the past and are likely counting on more improvements in mortgage rates. Time will tell," Caballero added.
The average number of Days on Market for new homes in Texas improved slightly in July, falling to 107.61 days from 108.19 in June. Houston remained the fastest-selling major market with a DOM of 91.50 days, down from 92.69. Austin followed at 97.93 days, improving from 100.61. Dallas-Ft. Worth decreased to 133.92 days from 136.39, while San Antonio rose to 96.26 days from 91.52, posting the largest monthly increase.
![]()
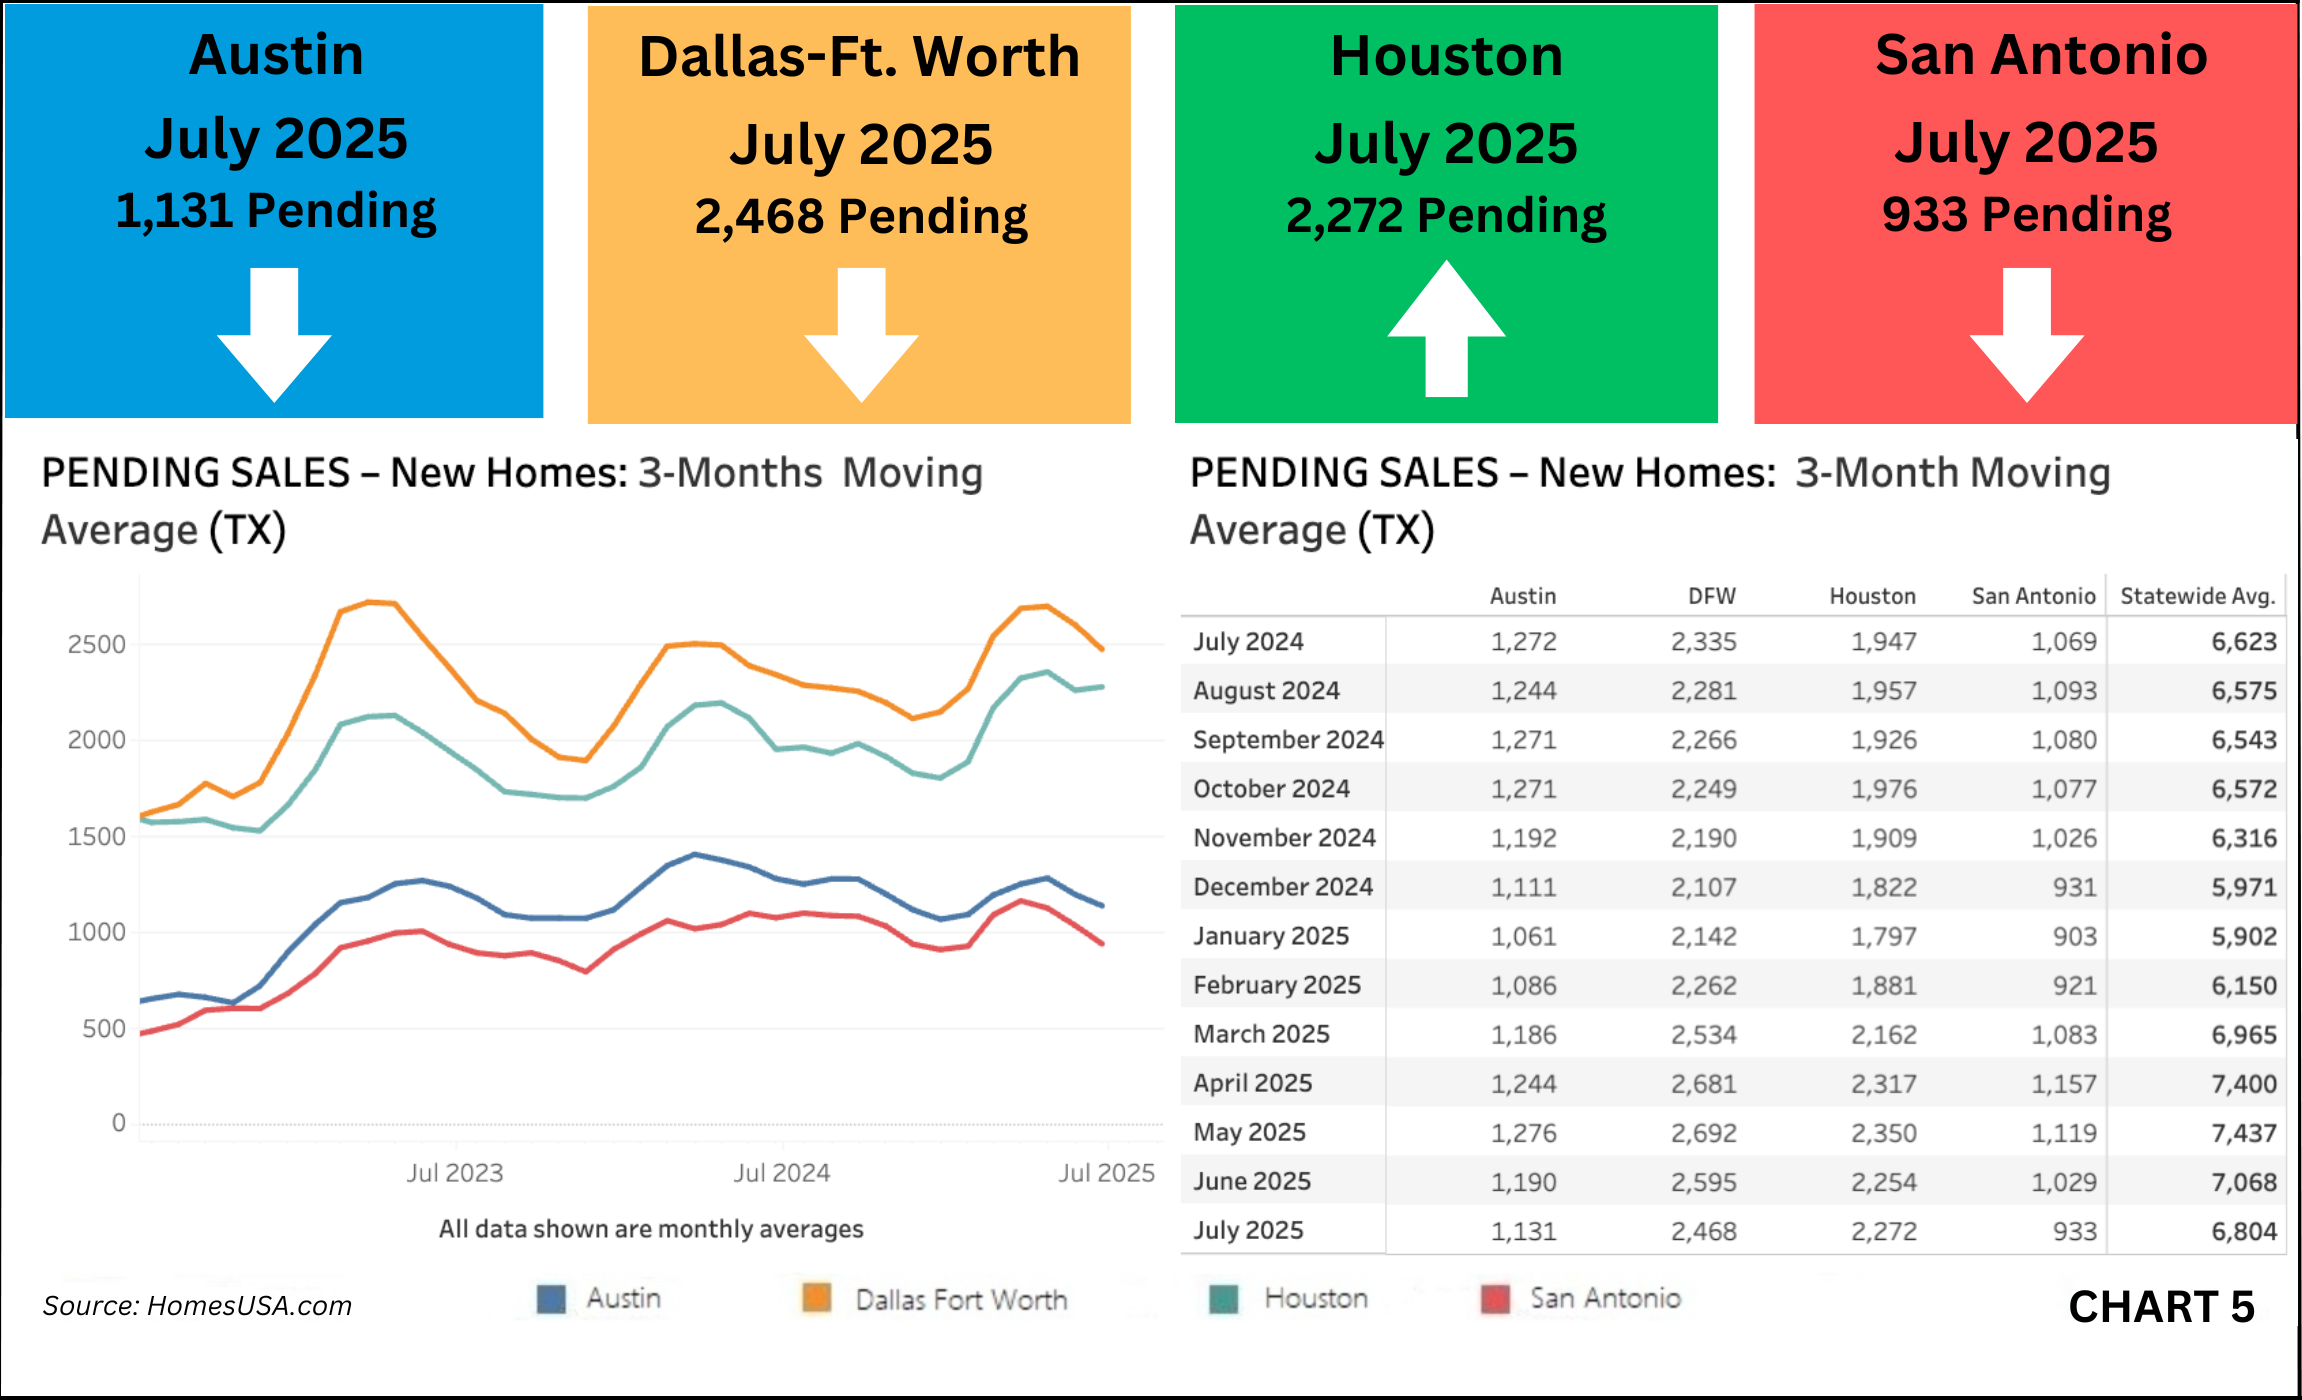
Pending new home sales in Texas declined in July, suggesting a further easing in future closings. Statewide pending sales dropped to 6,804 from 7,068 in June. Dallas-Ft. Worth fell to 2,468 from 2,595, while Houston inched up to 2,272 from 2,254. Austin decreased to 1,131 from 1,190, and San Antonio slipped to 933 from 1,029.
HomesUSA.com is sharing its Texas New Home Sales Report and New Home Sales Index at the same time the Commerce Department releases its nationwide New Residential Sales Report for July, set for Monday, August 25, 2025, at 10:00 am Eastern time.
About the Report
The HomesUSA.com monthly report covers closed sales recorded in MLSs by the 10th day of the following month. The report features 3-month and 12-month moving averages for six essential market data points, including DOM, sales volume, sales prices, sales-to-list price ratio, pending sales, and active listings. Caballero explained the 3-month moving average indices track market seasonality, while the 12-month moving average removes seasonality and tracks the longer trend.
Days on Market Improves – New Homes in Texas (Exclusive Data)
The HomesUSA.com New Home Sales Index showed that the pace of new home sales improved in July, as the average number of Days on Market declined statewide. The 3-month moving average of Days on Market for new homes in Texas improved slightly in July, falling to 107.61 days from 108.19 in June.
Among the state’s four major new home markets, Houston remained the fastest-selling major market with a DOM of 91.50 days, down from 92.69. Austin followed at 97.93 days, improving from 100.61. Dallas-Ft. Worth decreased to 133.92 days from 136.39, while San Antonio rose to 96.26 days from 91.52, posting the largest monthly increase.
Note: New homes typically spend more time on the market than existing homes because many are listed while still under construction. Each MLS may calculate DOM differently, so direct comparisons may not always be reliable. (See Chart 1: Texas New Homes Days on Market)
Texas New Home Sales Decline
Based on all local MLS data – the most reliable and current source of home sales activity, Texas new home sales decreased in July, continuing last month’s decline. The 3-month moving average of new home sales statewide dropped to 6,225 sales from 6,394 in June. Houston sales declined to 2,281 from 2,297 the prior month. Dallas-Ft. Worth posted 2,141 sales, down from 2,153 in June, while Austin dropped to 854 from 870. San Antonio recorded the steepest monthly drop, falling to 948 sales from 1,073. (See Chart 2: Texas New Home Sales)
Texas New Home Prices Mixed
Average new home prices in Texas showed mixed results in July. The statewide 3-month moving average of new home prices rose slightly in July to $425,204 from $422,525 in June. Austin prices rose to $489,692 versus $486,276, while Houston prices were relatively flat at $400,906 from $399,175. San Antonio saw the largest percentage increase, climbing to $355,262 from $339,865. Dallas-Ft. Worth posted the only decline, falling to $457,305 from $463,401.
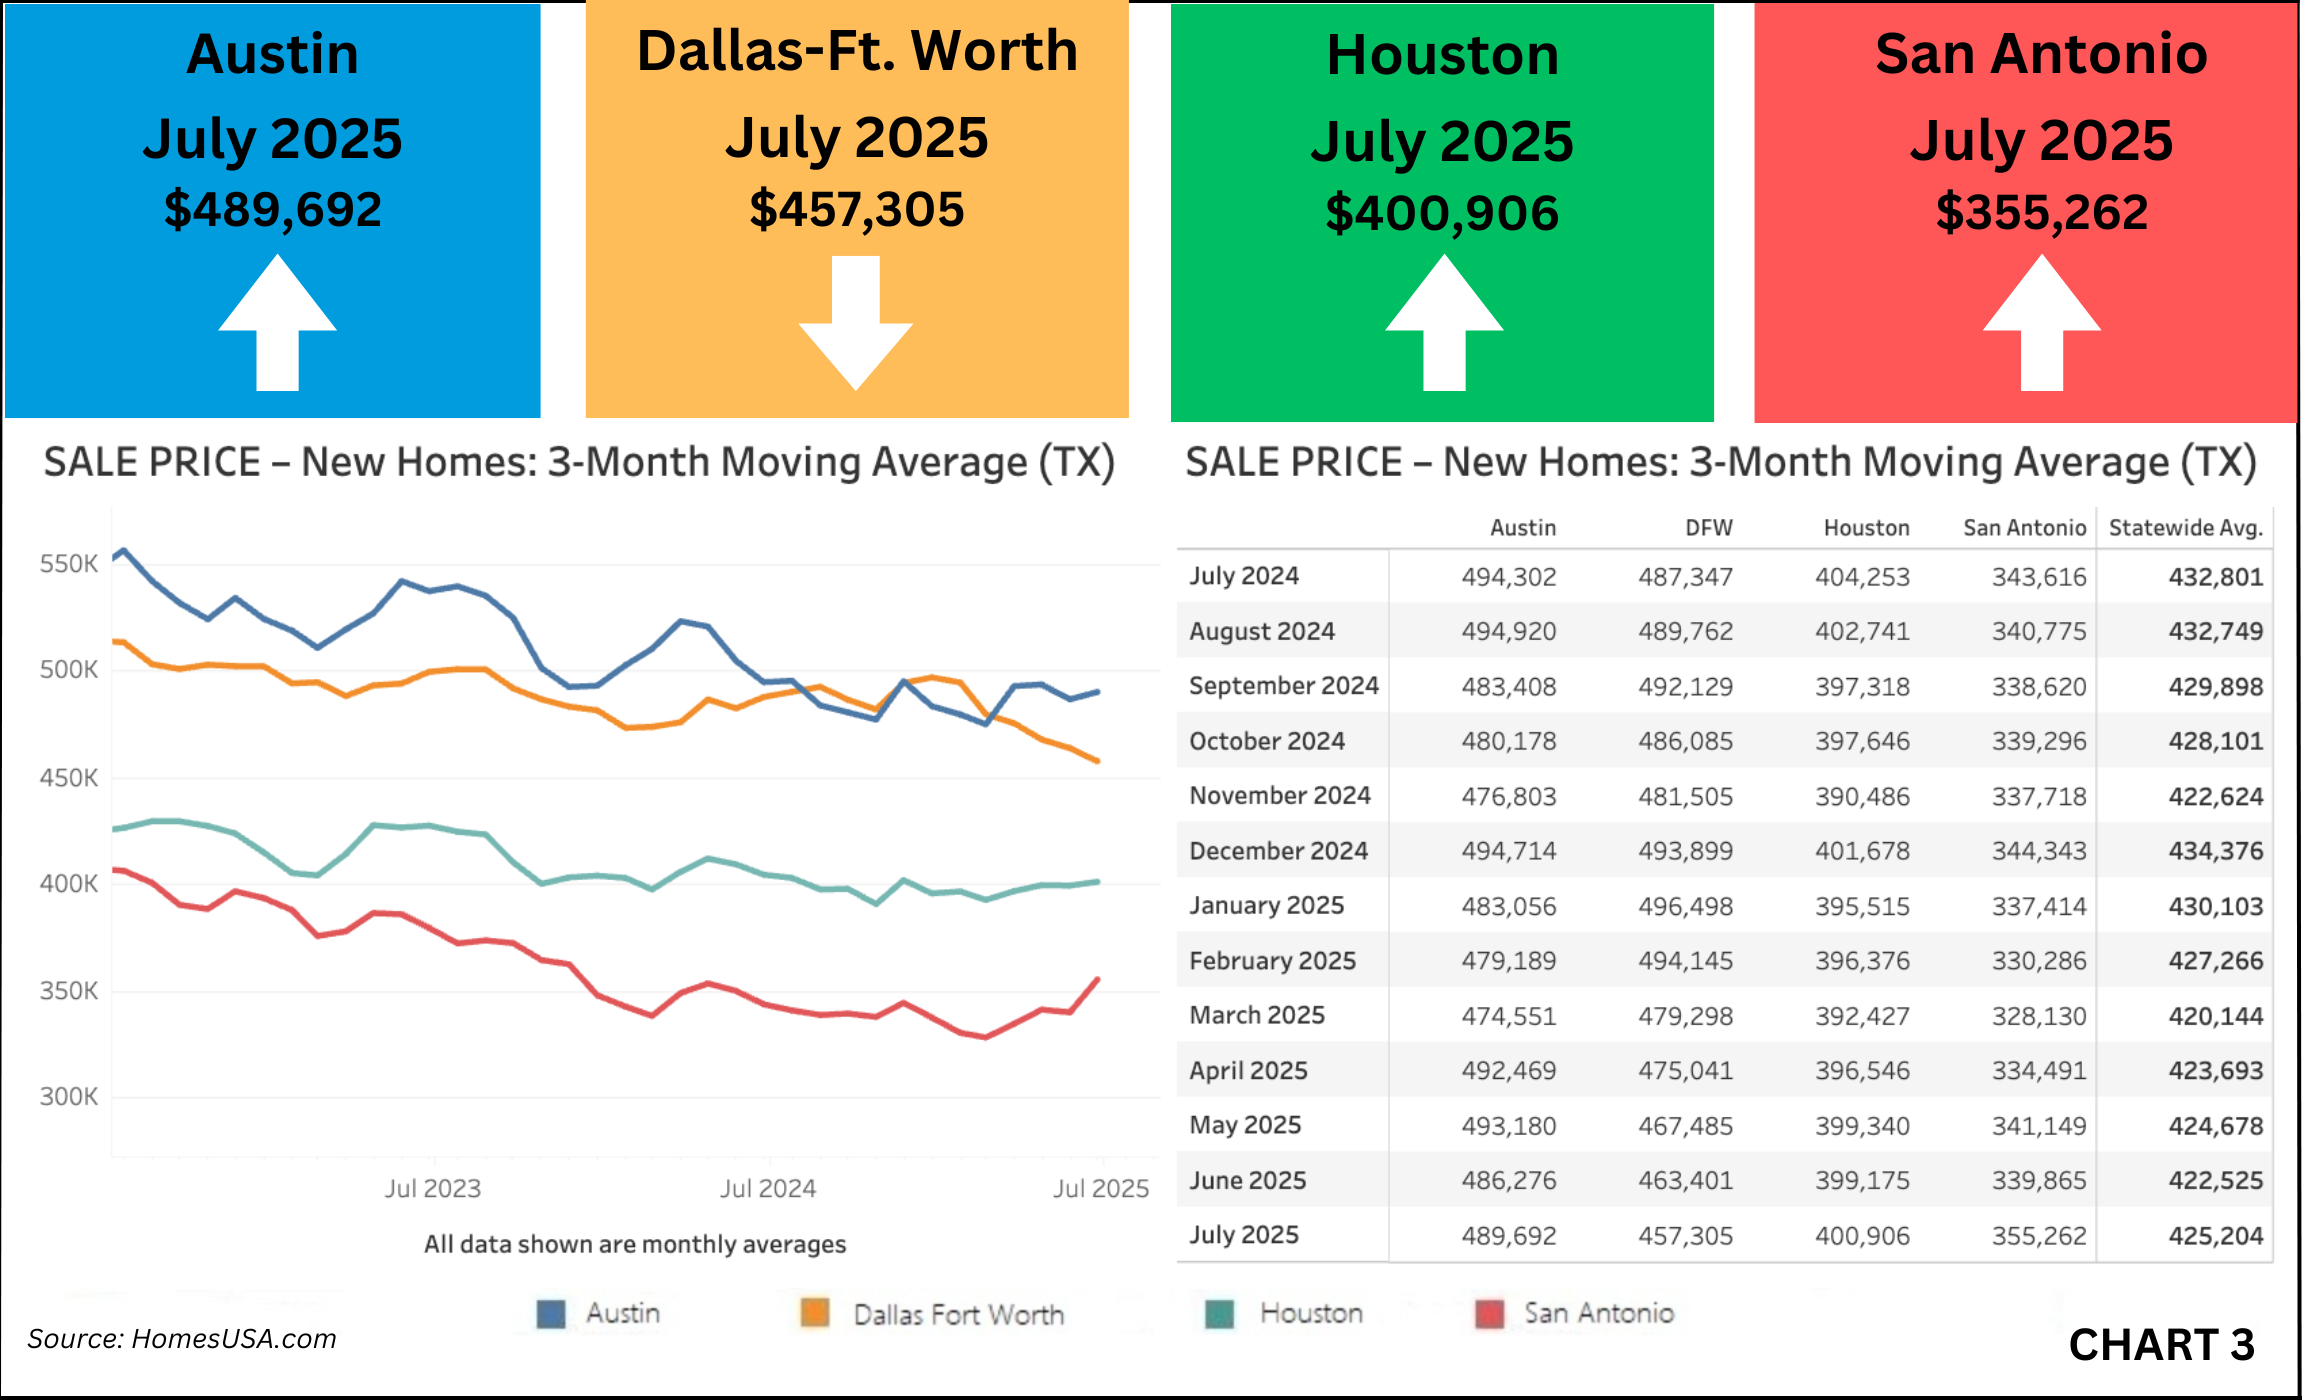
Note: San Antonio’s July price data does not include a market anomaly: seven homes priced at over $2 million sold during the month. (See Chart 3: Texas New Home Prices)
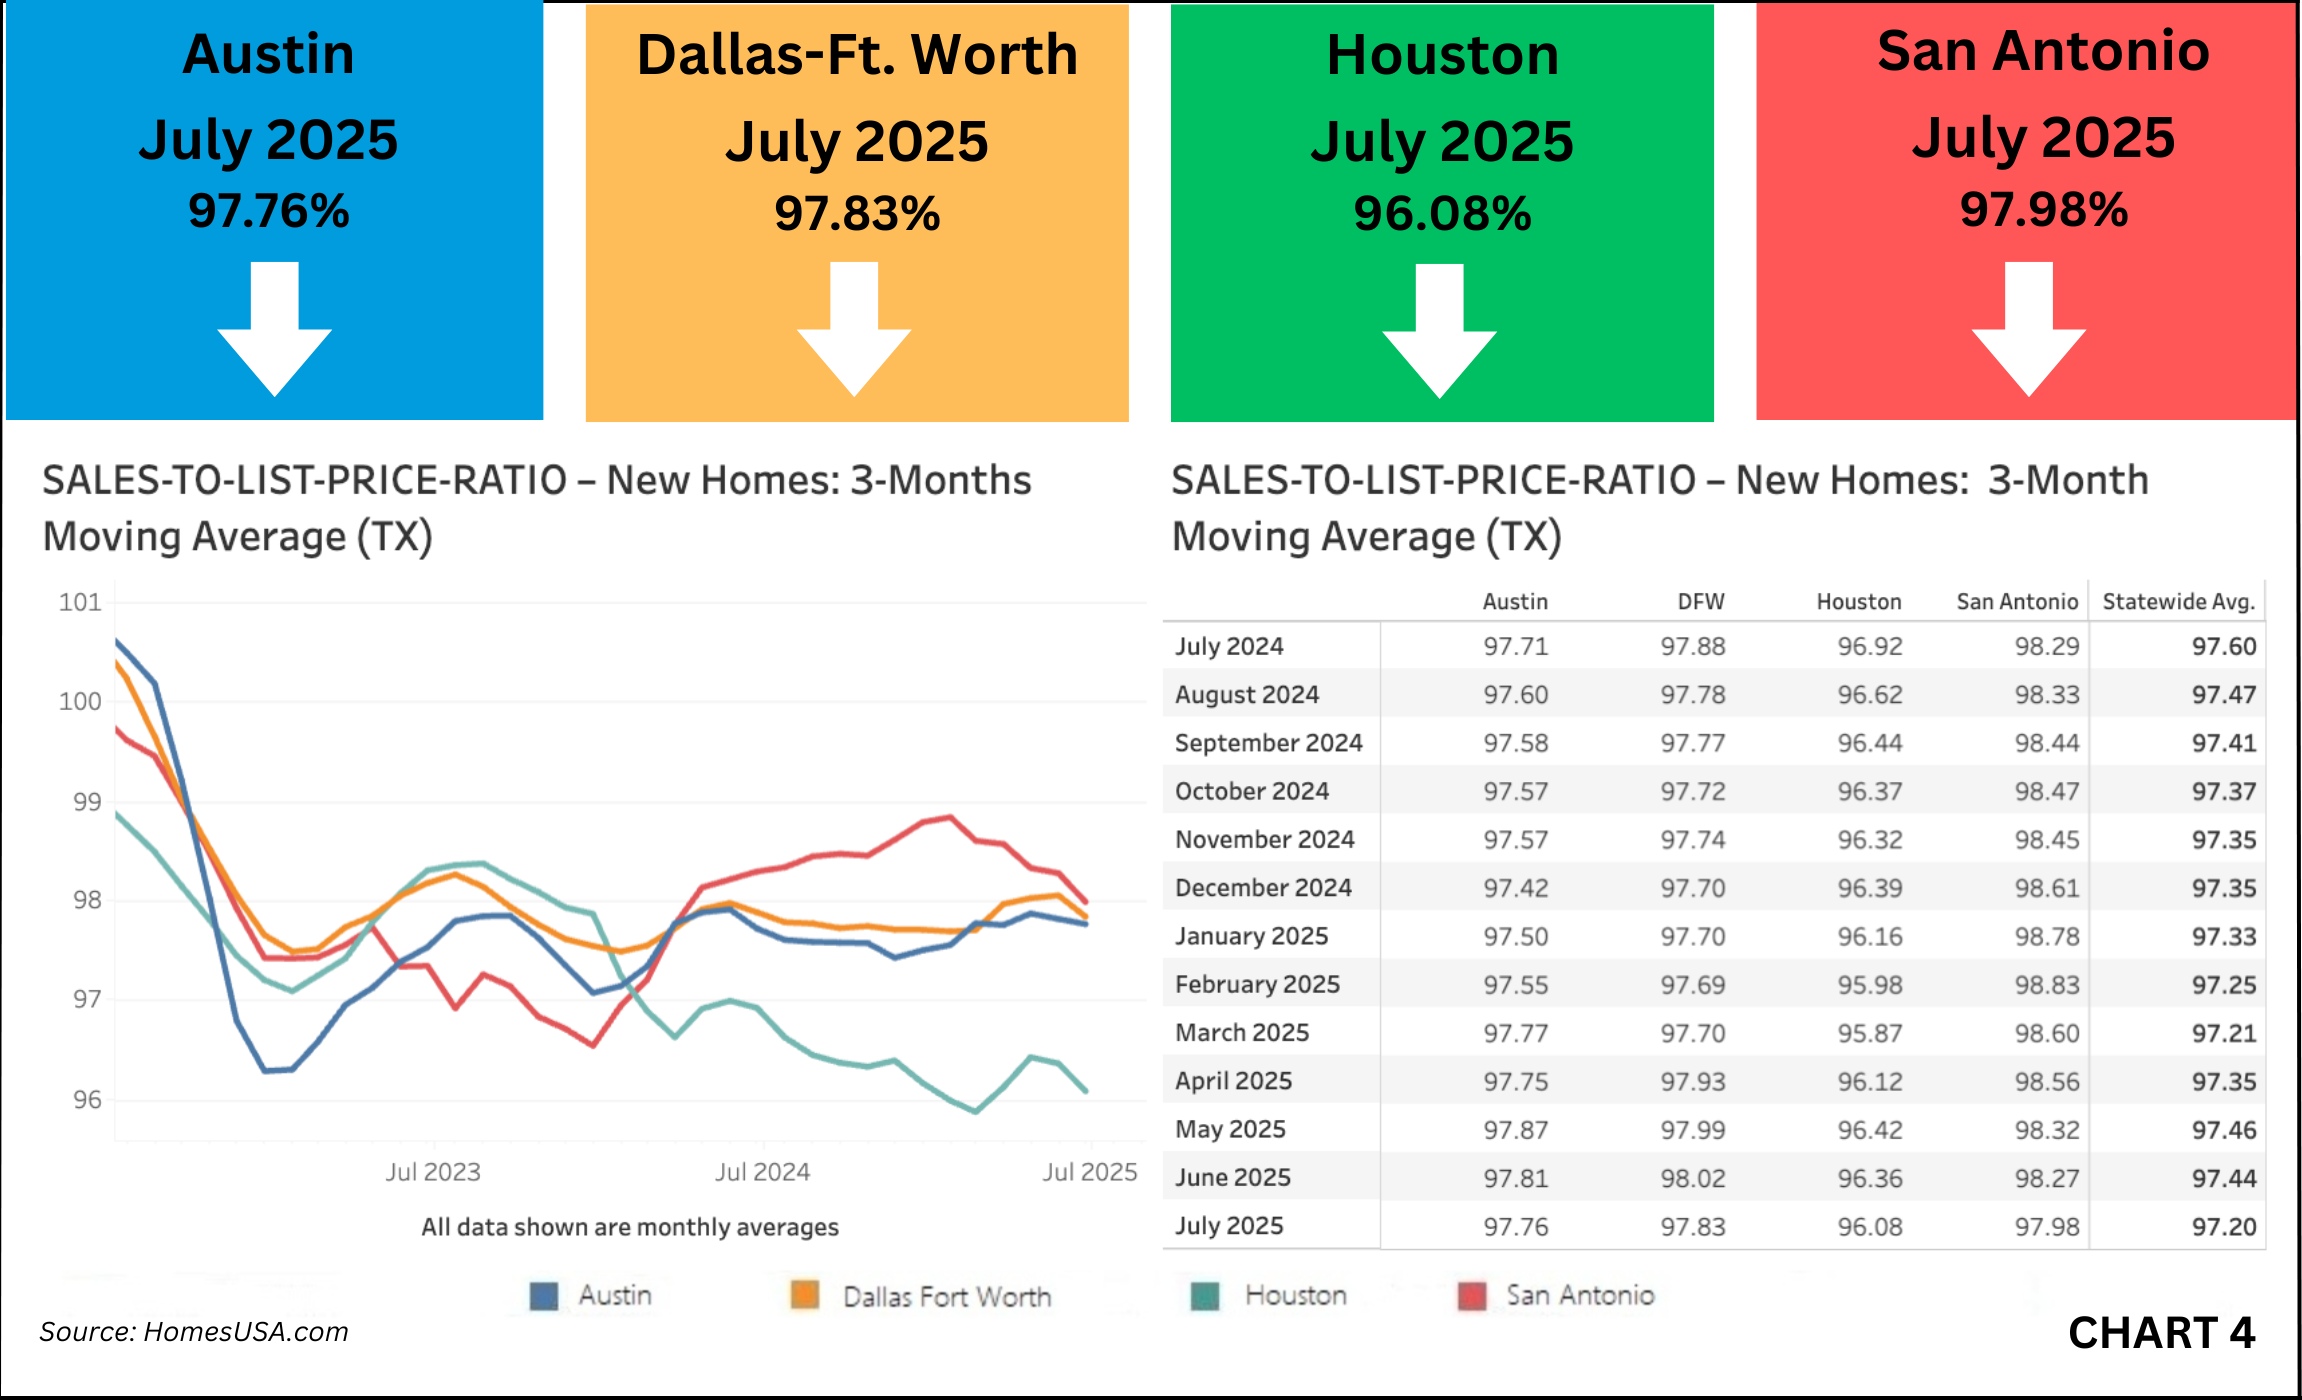
Texas Sales-to-List Price Ratio Eases
The statewide sales-to-list price ratio for new homes declined slightly in July. The 3-month moving average dropped to 97.20 percent, compared to 97.44 percent in June.
Dallas-Ft. Worth posted a ratio of 97.83 percent, slightly lower from 98.02 percent, while Austin was at 97.76 percent, also slightly lower from 97.81 percent. San Antonio posted the highest ratio at 97.98 percent, down from 98.27 percent, and Houston recorded the lowest at 96.08 percent, also down from 96.36 percent. (See Chart 4: Texas Sales-to-List Price Ratio.
Texas Pending New Home Sales Decline
Pending new home sales in Texas declined in July, suggesting a possible easing in future closings. The 3-month moving average statewide dropped to 6,804 from 7,068 in June. Dallas-Ft. Worth fell to 2,468 from 2,595, while Houston inched up to 2,272 from 2,254. Austin decreased to 1,131 from 1,190, and San Antonio slipped to 933 from 1,029. (See Chart 5: Texas Pending New Home Sales)
Texas Active Listings for New Homes Reach Record High
Active new home listings statewide climbed to 35,064 in July, up from 34,203 in June. It was the highest total of active listings since HomesUSA.com began tracking monthly data in December 2017. Houston led with 14,570 listings, rising from 14,328. Dallas-Ft. Worth saw the biggest month-over-month jump, increasing to 8,852 from 8,497. Austin’s inventory grew to 6,016 from 5,913, and San Antonio rose to 5,626 from 5,465. Statewide inventory was up 11.8% from 31,358 in July 2024. (See Chart 6: Texas Active Listings)
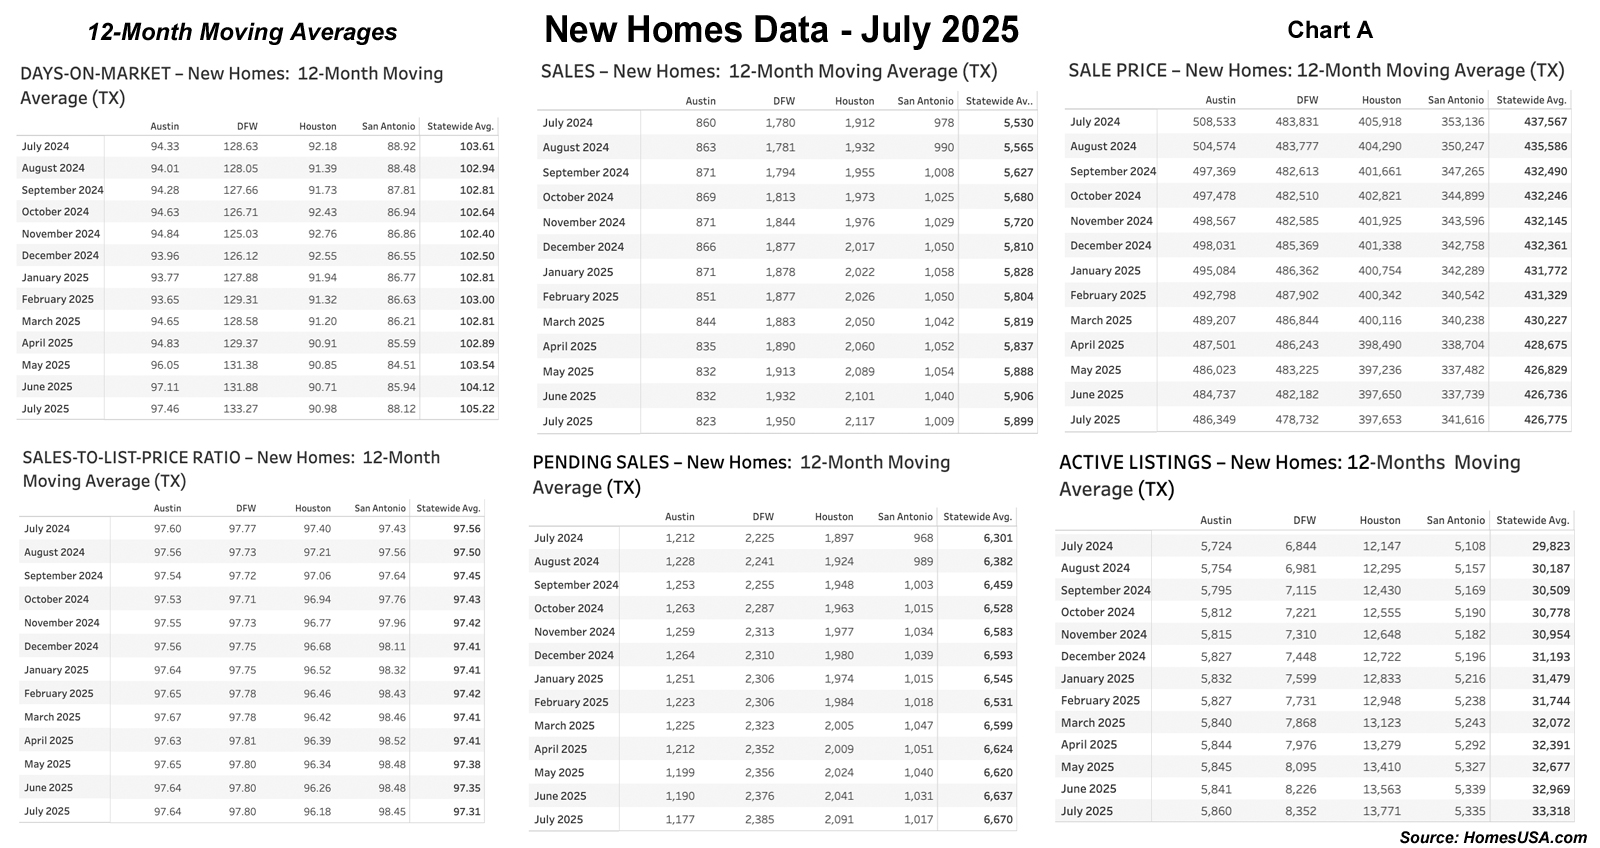
About the HomesUSA.com New Home Sales Index
The HomesUSA.com Index is reported as both a 3-month and 12-month moving average of the Days on Market for new homes listed in the local Multiple Listing Services (MLSs) for Dallas-Ft. Worth, Houston, Austin, and San Antonio. Created by Ben Caballero, it is the first Days on Market index to track the Texas new home market based on activity in its largest markets and includes homes listed while under construction. (See Chart A: 12-Month Moving Averages)
About Ben Caballero and HomesUSA.com®
Ben Caballero, founder and CEO of HomesUSA.com, is a three-time Guinness World Records title holder for “Most annual home sale transactions through MLS by an individual sell-side real estate agent – current.” Ranked by REAL Trends as America’s top real estate agent for home sales since 2013, Ben is the most productive real estate agent in U.S. history.
He is the only individual real estate agent to reach nearly $4 billion in residential sales transactions in a single year ($3.93 billion in 2024), the first agent to exceed $3 billion (2022), the first to exceed $2 billion (2018–2020), and the first to exceed $1 billion (2015–2017). An award-winning innovator and technology pioneer, Ben works with more than 60 home builders in Dallas-Fort Worth, Houston, Austin, and San Antonio. Ben’s podcast series is available widely, including iTunes, Spotify, and YouTube. Learn more at HomesUSA.com | Twitter: @bcaballero - @HomesUSA | Facebook: /HomesUSAdotcom.
Note for journalists: You may contact Ben Caballero directly by email at ben@homesusa.com.
REALTOR® is a federally registered collective membership mark which identifies a real estate professional who is a member of the NATIONAL ASSOCIATION OF REALTORS® and subscribes to its strict Code of Ethics.
Media Contact:
Kevin Hawkins
(206) 866-1220
kevin@wavgroup.com
Image: Ben Caballero
https://bit.ly/ben-caballero-photo
Individual Chart images:
Chart 1: Days on Market – Thru July 2025: https://homesusa.com/wp-content/uploads/2025/08/Chart-1-Texas-New-Homes-Tracking-Days-on-Market.png
Chart 2: New Home Sales – Thru July 2025: https://homesusa.com/wp-content/uploads/2025/08/Chart-2-Texas-New-Home-Sales-Market.png
Chart 3: Sales Prices – Thru July 2025: https://homesusa.com/wp-content/uploads/2025/08/Chart-3-Texas-New-Home-Sales-Prices-Market.png
Chart 4: Sales-to-List-Price Ratio – Thru July 2025: https://homesusa.com/wp-content/uploads/2025/08/Chart-4-Texas-Sales-to-List-Price-Ratio-Market.png
Chart 5: Pending New Home Sales – Thru July 2025: https://homesusa.com/wp-content/uploads/2025/08/Chart-5-Texas-Pending-New-Home-Sales-Market.png
Chart 6: Active Listings – Thru July 2025: https://homesusa.com/wp-content/uploads/2025/08/Chart-6-Texas-Active-Listings-for-New-Homes-Market.png
Chart A: 12-Month Moving Averages – Thru July 2025: https://homesusa.com/wp-content/uploads/2025/08/Chart-A-12MonthChart-DataOnly.jpg

![]()