
- Online prices dropped 1% year-over-year and 2% month-over-month in July
- Electronics, apparel and toys drove down prices online, while food costs remained elevated
- Consumers spent $73.7 billion online in July, down from $74.1 billion in June
Adobe (Nasdaq:ADBE) today announced the latest online inflation data from the Adobe Digital Price Index (DPI), powered by Adobe Analytics. In July 2022, online prices decreased 1% year-over-year (YoY)—after increasing 0.3% YoY in June and 2% YoY in May—and dropped 2% on a monthly basis. July is the first month where e-commerce entered deflation, after 25 consecutive months of persistent inflation online. Most of the categories tracked by the DPI (14 out of 18) saw month-over-month (MoM) price decreases in July.
This press release features multimedia. View the full release here: https://www.businesswire.com/news/home/20220809005369/en/
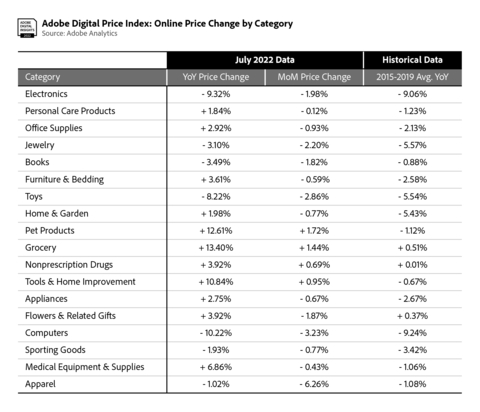
Price Table Year over Year (Graphic: Business Wire)
Prices for electronics, the largest category in e-commerce with 18.6% share of spend in 2021, fell sharply and decreased 9.3% YoY (down 2% MoM). This is a greater YoY decrease than June (down 7.3% YoY) and May (down 6.5% YoY). Prices for apparel fell 1% YoY (down 6.3% MoM), marking the second consecutive month where prices fell after dropping 0.1% YoY in June. Apparel prices had increased for 14 consecutive months since April 2021, with prices having spiked in recent months (up 9% YoY in May, 12.3% YoY in April and 16.3% YoY in March). Toy prices fell significantly, dropping 8.2% YoY (down 2.9% MoM), a record YoY low for the category in the last 31 months. Food costs remained high however, with grocery prices rising 13.4% YoY (up 1.4% MoM), a record YoY high and the largest increase of any category.
In July, consumers spent $73.7 billion online, $400 million less than the prior month ($74.1 billion). On a YoY basis however, e-commerce spend in July grew 20.9%, with Prime Day driving record online sales for the retail industry overall. Online spending in July also decreased compared to May ($78.8 billion) and April ($77.8 billion). E-commerce demand remains resilient on a year-to-date basis, with consumers spending $525.4 billion online in 2022 so far, growing 9.2% YoY.
“Wavering consumer confidence and a pullback in spending, coupled with oversupply for some retailers, is driving prices down in major online categories like electronics and apparel,” said Patrick Brown, vice president of growth marketing and insights, Adobe. “It provides a bit of relief for consumers, as the cost of food continues to rise both online and in stores.”
The DPI provides the most comprehensive view into how much consumers pay for goods online, as e-commerce expands to new categories and as brands focus on making the digital economy personal. Powered by Adobe Analytics, it analyzes one trillion visits to retail sites and over 100 million SKUs across 18 product categories: electronics, apparel, appliances, books, toys, computers, groceries, furniture/bedding, tools/home improvement, home/garden, pet products, jewelry, medical equipment/supplies, sporting goods, personal care products, flowers/related gifts, non-prescription drug and office supplies.
In July, 11 of the 18 categories tracked by the DPI saw YoY price increases, with groceries rising the most. Price drops were observed in seven categories: electronics, jewelry, books, toys, computers, sporting goods and apparel.
Only four of the 18 categories in the DPI saw price increases MoM. Price drops were observed across 14 categories including electronics, personal care products, office supplies, jewelry, books, furniture/bedding, toys, home/garden, appliances, flowers/related gifts, computers, sporting goods, medical equipment/supplies and apparel.
Notable categories in the Adobe Digital Price Index for July:
- Electronics: Prices were down 9.3% YoY (down 2% MoM), bringing it back to pre-pandemic levels when electronic prices fell 9.1% YoY on average between 2015 and 2019. As the biggest category in e-commerce by share of spend, price movements have an outsized impact on overall inflation online.
- Apparel: Prices were down 1% YoY, while falling significantly on a monthly basis (down 6.3% MoM). This is the first notable YoY decrease for the category, as prices only fell by 0.1% YoY in June. It comes after 14 consecutive months where prices had risen consistently, reversing a predictable pattern of heavy discount periods.
- Toys: Prices were down 8.2% YoY (down 2.9% MoM), the largest YoY drop for the category since December 2019, when prices were down 10% YoY during the holiday shopping season. This is the 16th consecutive month of deflation for the category, after prices had risen 0.2% YoY in March 2021.
- Groceries: Prices continued to surge and rose 13.4% YoY (up 1.4% MoM), more than any other category. It is a new YoY record, following a 12.4% YoY increase in June, a 11.7% YoY increase in May and a 10.3% YoY increase in April—all previous record highs. Grocery prices have risen for 30 consecutive months, and it remains the only category to move in lockstep with the Consumer Price Index on a long-term basis.
- Pet Products: Prices were up 12.6% YoY (up 1.7% MoM), a record YoY high for the category. This follows a 11.3% YoY increase in June, and a 9.1% YoY increase in May. Online inflation for pet products has now been observed for 27 consecutive months, as pet ownership surged during the COVID-19 pandemic and demand for related goods remains high.
Methodology
The DPI is modeled after the Consumer Price Index (CPI), published by the U.S. Bureau of Labor Statistics and uses the Fisher Price Index to track online prices. The Fisher Price Index uses quantities of matched products purchased in the current period (month) and a previous period (previous month) to calculate the price changes by category. Adobe’s analysis is weighted by the real quantities of the products purchased in the two adjacent months.
Powered by Adobe Analytics, Adobe uses a combination of Adobe Sensei, Adobe’s AI and machine learning framework, and manual effort to segment the products into the categories defined by the CPI manual. The methodology was first developed alongside renowned economists Austan Goolsbee and Pete Klenow.
About Adobe
Adobe is changing the world through digital experiences. For more information, visit www.adobe.com.
© 2022 Adobe. All rights reserved. Adobe and the Adobe logo are either registered trademarks or trademarks of Adobe in the United States and/or other countries. All other trademarks are the property of their respective owners.
View source version on businesswire.com: https://www.businesswire.com/news/home/20220809005369/en/
Contacts
Public relations contacts
Kevin Fu
Adobe
kfu@adobe.com
Bassil Elkadi
Adobe
belkadi@adobe.com


