Business reopenings rise across the country, spiking in the second quarter of 2021
New business openings for home, local and automotive services increase above pre-pandemic levels
Yelp Inc. (NYSE: YELP), the company that connects people with great local businesses, today released second quarter 2021 data for the Yelp Economic Average (YEA) report, a benchmark of local economic strength in the U.S. The Q2 2021 YEA report reveals a significant correlation between consumer interest on Yelp and an increase of fully vaccinated populations across states and counties. The report also uncovers business reopenings reaching its highest level in a year and new business openings surpassing pre-pandemic levels.
This press release features multimedia. View the full release here: https://www.businesswire.com/news/home/20210721005253/en/

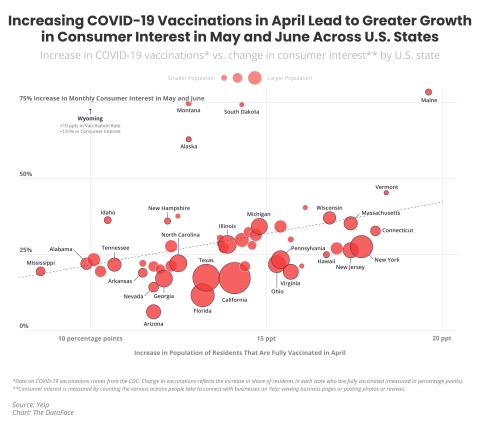
The Yelp Economic Average shows increases in consumer interest correlates to an increase in vaccinations. (Graphic: Business Wire)
YEA analysis shows that the increase in vaccinated people in a specific geographic location in April correlates to an increase in consumer interest on Yelp in that area in May and June. Business reopenings spiked in Q2 2021, with restaurant and food businesses, as well as retail businesses, driving the largest share of the total 60,502 businesses reopened. New business openings on Yelp grew to 150,940, surpassing pre-pandemic levels by 8% (compared to Q2 2019) and up from 146,160 in Q1 2021.
“With the lifting of pandemic restrictions across the country in the second quarter, restaurants, food, and nightlife businesses among others, reflected pent-up demand to return to pre-pandemic activities,” said Justin Norman, Yelp’s vice president of data science. “Our analysis highlights an upward trend in the first half of 2021 in business openings and reopenings across the country. Our recent finding that an increase in fully vaccinated populations in certain areas led to a higher increase in consumer interest in local businesses, is evidence that getting vaccinated is good for business. We believe that increasing the number of vaccinated people will further aid the recovery.”
Increased COVID-19 Vaccinations in April Correlate to an Increase in Consumer Activity in May and June Across States and Counties, with Clear Trends Across Voting Lines and Regions
Maine, Vermont, Connecticut, New York, and Massachusetts were among the 10 states with the highest increases in percentage of vaccinated people in April and all had average increases in monthly consumer interest of 25% or higher in May and June. Eight of the 10 states with the lowest increases in percentage of vaccinated people in April, including Arizona, Tennessee, Alabama, and Mississippi, had increases in average monthly consumer interest of less than 25% in May and June.
When examined across voting lines based on the 2020 election, the data shows a majority of states with increased vaccinations and increased levels of consumer interest voted Democrat, with 94% of all Democratic states having a 15% or greater increase in vaccinated people and 19% or higher increase in average monthly consumer interest. By region, the south accounts for the largest share of less vaccinated populations and generally lower increases in average monthly consumer interest levels, while the northeast has the largest share of more vaccinated people and higher average monthly consumer interest.
Of the 300 counties with the highest populations, nine out of 10 counties with the largest increase in vaccinated people in April saw a 21% or higher increase in average monthly consumer interest in May and June. Similarly, seven out of 10 counties, with the lowest percentage changes in vaccinated people, saw a 20% or less increase in average monthly consumer interest.
Q2 Business Reopenings Reach Highest Level in a Year as Americans Ease Back Into In-Person Activities
In Q2 2021, 60,502 businesses reopened, marking the highest volume of reopenings in the last year. In April alone there were 38,725 reopenings, the largest monthly volume of reopenings since May 2020. Restaurant and food businesses, as well as retail businesses, experienced the highest number of businesses that reopened in Q2 with 22,441 and 13,700 reopenings, respectively.
New Businesses Open Above Pre-Pandemic Levels in Professional, Home and Local, and Automotive Services, While Restaurants and Other Categories Inch Closer to a Full Recovery
In Q2 2021 new business openings on Yelp reached 150,940, surpassing pre-pandemic levels by 8% (compared to Q2 2019) and up from 146,160 in Q1 2021.
Home services accounted for 51,445 of new businesses opened in Q2 2021, a 48% increase compared to pre-pandemic levels (Q2 2019) — lawn services (3,165 openings, up 189% from Q2 2019), home cleaning (6,558, up 139%), and drywall installation and repair (1,253, up 119%) saw a surge in new openings.
Local services saw 16,047 new businesses open in Q2 2021, a 30% increase compared to pre-pandemic levels with nannies (86 openings, up 91%), carpet cleaning (1,282, up 62%), and junk removal and hauling services (2,328, up 162%) driving the increase. Professional and automotive-related services also saw significant momentum with 13,907 new businesses open in Q2 2021 (21% increase compared to pre-pandemic levels) and 9,708 new openings (13% increase), respectively.
Restaurants and food businesses accounted for 19,968 new businesses opened in Q2 2021, 12% below Q2 2019, which had the highest new business openings in the last five years. Even as restaurants reopen, food delivery services (670 openings, up 166% from Q2 2019) remain well above pre-pandemic levels. Food trucks (1,767, up 25%), seafood markets (81, up 44%), soul food (176, up 30%), desserts (1,628, up 47%), and food courts (59, up 40%) have all trended above pre-pandemic levels.
Read the full report, as well as previous YEA reports, at yelpeconomicaverage.com. Assets and images from the Q2 2021 YEA report can be found here. For more information and Yelp’s latest company metrics, visit: https://www.yelp-press.com/company/fast-facts/default.aspx
Methodology
Consumer Interest Correlations with COVID-19 Vaccinations
COVID-19 Vaccinations: The vaccination period is the percentage point increase in vaccinations in the specific geographic location measured between April 1 and April 30, corresponding to the time where most locations began to open vaccine distribution to the general public over 18 years old. For example, an increase from 20% of a location’s total population being vaccinated at the end of March to 38% of the population being vaccinated at the end of April would be an increase of 18 percentage points. We used COVID-19 vaccination data provided by the CDC for counties and states. Note: the CDC did not have April vaccination data available for some counties in Texas, Hawaii, and California. Those counties were excluded from the analysis.
Consumer Interest: We measure consumer interest, in terms of U.S. counts of a few of the many actions people take to connect with businesses on Yelp: viewing business pages or posting photos or reviews — split by state and county.
Correlations: Increasing consumer interest in these geographic locations in May and June – relative to the April change in percentage of vaccinated people – is a good general indicator of consumer behavior reverting to the norm and a state or county being more active economically and socially. Of note, correlation and causation are not equivalent, and we are not claiming that COVID-19 vaccinations are single-handedly driving consumer interest. Yelp observes a statistically significant correlation between a state’s or county’s change in percentage of vaccinated people in April and consumer interest action share changes in May and June. The relationship holds out after controlling for other variables, including case counts, mask usage, and political lean, according to regressions we ran at the state and county levels.
New Business Openings
Openings are determined by counting new businesses listed on Yelp, which are added by either business owners or Yelp users. Openings are adjusted year over two-years (2021 vs 2019), meaning openings are relative to the same period of time in the period two years prior for the same category and geographic location. This adjustment corrects for both seasonality and the baseline level of Yelp coverage in any given category and geography.
Business Reopenings
On each date, starting with March 1, 2020, we count U.S. businesses that were temporarily closed and reopened through June 30, 2021. A reopening is of a temporary closure, whether by using Yelp’s temporary closure feature or by editing hours, excluding closures due to holidays. Each reopened business is counted at most once, on the date of its most recent reopening.
Openings and reopenings are based on when they're indicated on Yelp, as such, the data may lag slightly from the true opening or reopening date due to a delay in reporting from consumers and business owners.
About Yelp Inc.
Yelp Inc. (www.yelp.com) connects people with great local businesses. With unmatched local business information, photos and review content, Yelp provides a one-stop local platform for consumers to discover, connect and transact with local businesses of all sizes by making it easy to request a quote, join a waitlist, and make a reservation, appointment or purchase. Yelp was founded in San Francisco in July 2004.
View source version on businesswire.com: https://www.businesswire.com/news/home/20210721005253/en/
Contacts
Yelp Inc.
Nick Spence
press@yelp.com


