
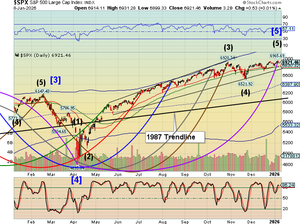
Market Indicators
World Markets
More


Sector ETFs
More Sectors| Sector | % Change | YTD % |
|---|---|---|
| Basic Materials | +0.49% |
+4.34% |
| Consumer Goods | +0.09% |
-0.06% |
| Energy | +0.16% |
+1.69% |
| Financial Services | +0.41% |
+2.20% |
| Healthcare | +0.47% |
+2.42% |
| Industrial | +0.45% |
+2.51% |
| Technology | +0.11% |
+0.06% |
| Telecom | +0.03% |
-1.56% |
| Utilities | +1.57% |
-1.09% |
Market News
View More


Currencies
More Currencies


More News
View More


Top 2 Materials Stocks That Are Set To Fly This Quarter ↗
Today 9:24 EST


D-Wave’s Year in Review: 2025 Wins Set the Stage for 2026 ↗
Today 9:25 EST

Leading And Lagging Sectors For January 9, 2026 ↗
Today 8:10 EST


How Is The Market Feeling About Nuvve Holding Corp? ↗
Today 8:01 EST


What 8 Analyst Ratings Have To Say About HealthEquity ↗
Today 8:01 EST


4 Analysts Assess Mattel: What You Need To Know ↗
Today 8:01 EST


Friday's pre-market session: top gainers and losers ↗
Today 8:30 EST


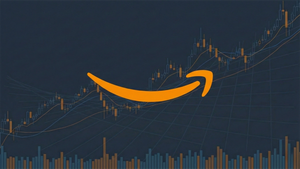
Amazon Starts 2026 Strong—What It Could Mean for the Year ↗
Today 7:09 EST


Is the Market Bullish or Bearish on Pinterest Inc? ↗
Today 8:01 EST


Stock Quote API & Stock News API supplied by www.cloudquote.io
Quotes delayed at least 20 minutes.
By accessing this page, you agree to the Privacy Policy and Terms Of Service.
Quotes delayed at least 20 minutes.
By accessing this page, you agree to the Privacy Policy and Terms Of Service.
© 2025 FinancialContent. All rights reserved.