
Uranium Energy Corp. (UEC) shares have seen notable upward movement, propelled by the rapidly escalating uranium prices. Prices have escalated to a decade-plus high this year as mounting anxieties about energy security prompt nations to reconsider nuclear energy in their shift from carbon-intensive fossil fuels to more sustainable energy options, especially in light of Russia's actions in Ukraine.
As a critical component for nuclear reactors, uranium is expected to see increased demand in the coming years. According to projections from the World Nuclear Association, nuclear capacity is estimated to expand by nearly 80%, and demand for uranium will likely double by 2040.
However, with Uranium Energy currently operating at a loss, it may be more beneficial for investors to explore alternative uranium stocks to capitalize on the potential upswing in nuclear energy. Furthermore, with its lofty valuation, there remains a significant risk factor. Its forward P/E of 105.80x is 914.6% higher than the industry average of 10.43x.
Despite UEC's recent impressive performance, it may not represent the most prudent investment choice at this juncture. Below, we discuss several key factors underpinning this cautious approach towards UEC.
Analysis of Uranium Energy Corp.'s Financial Performance and Growth, 2021-2023
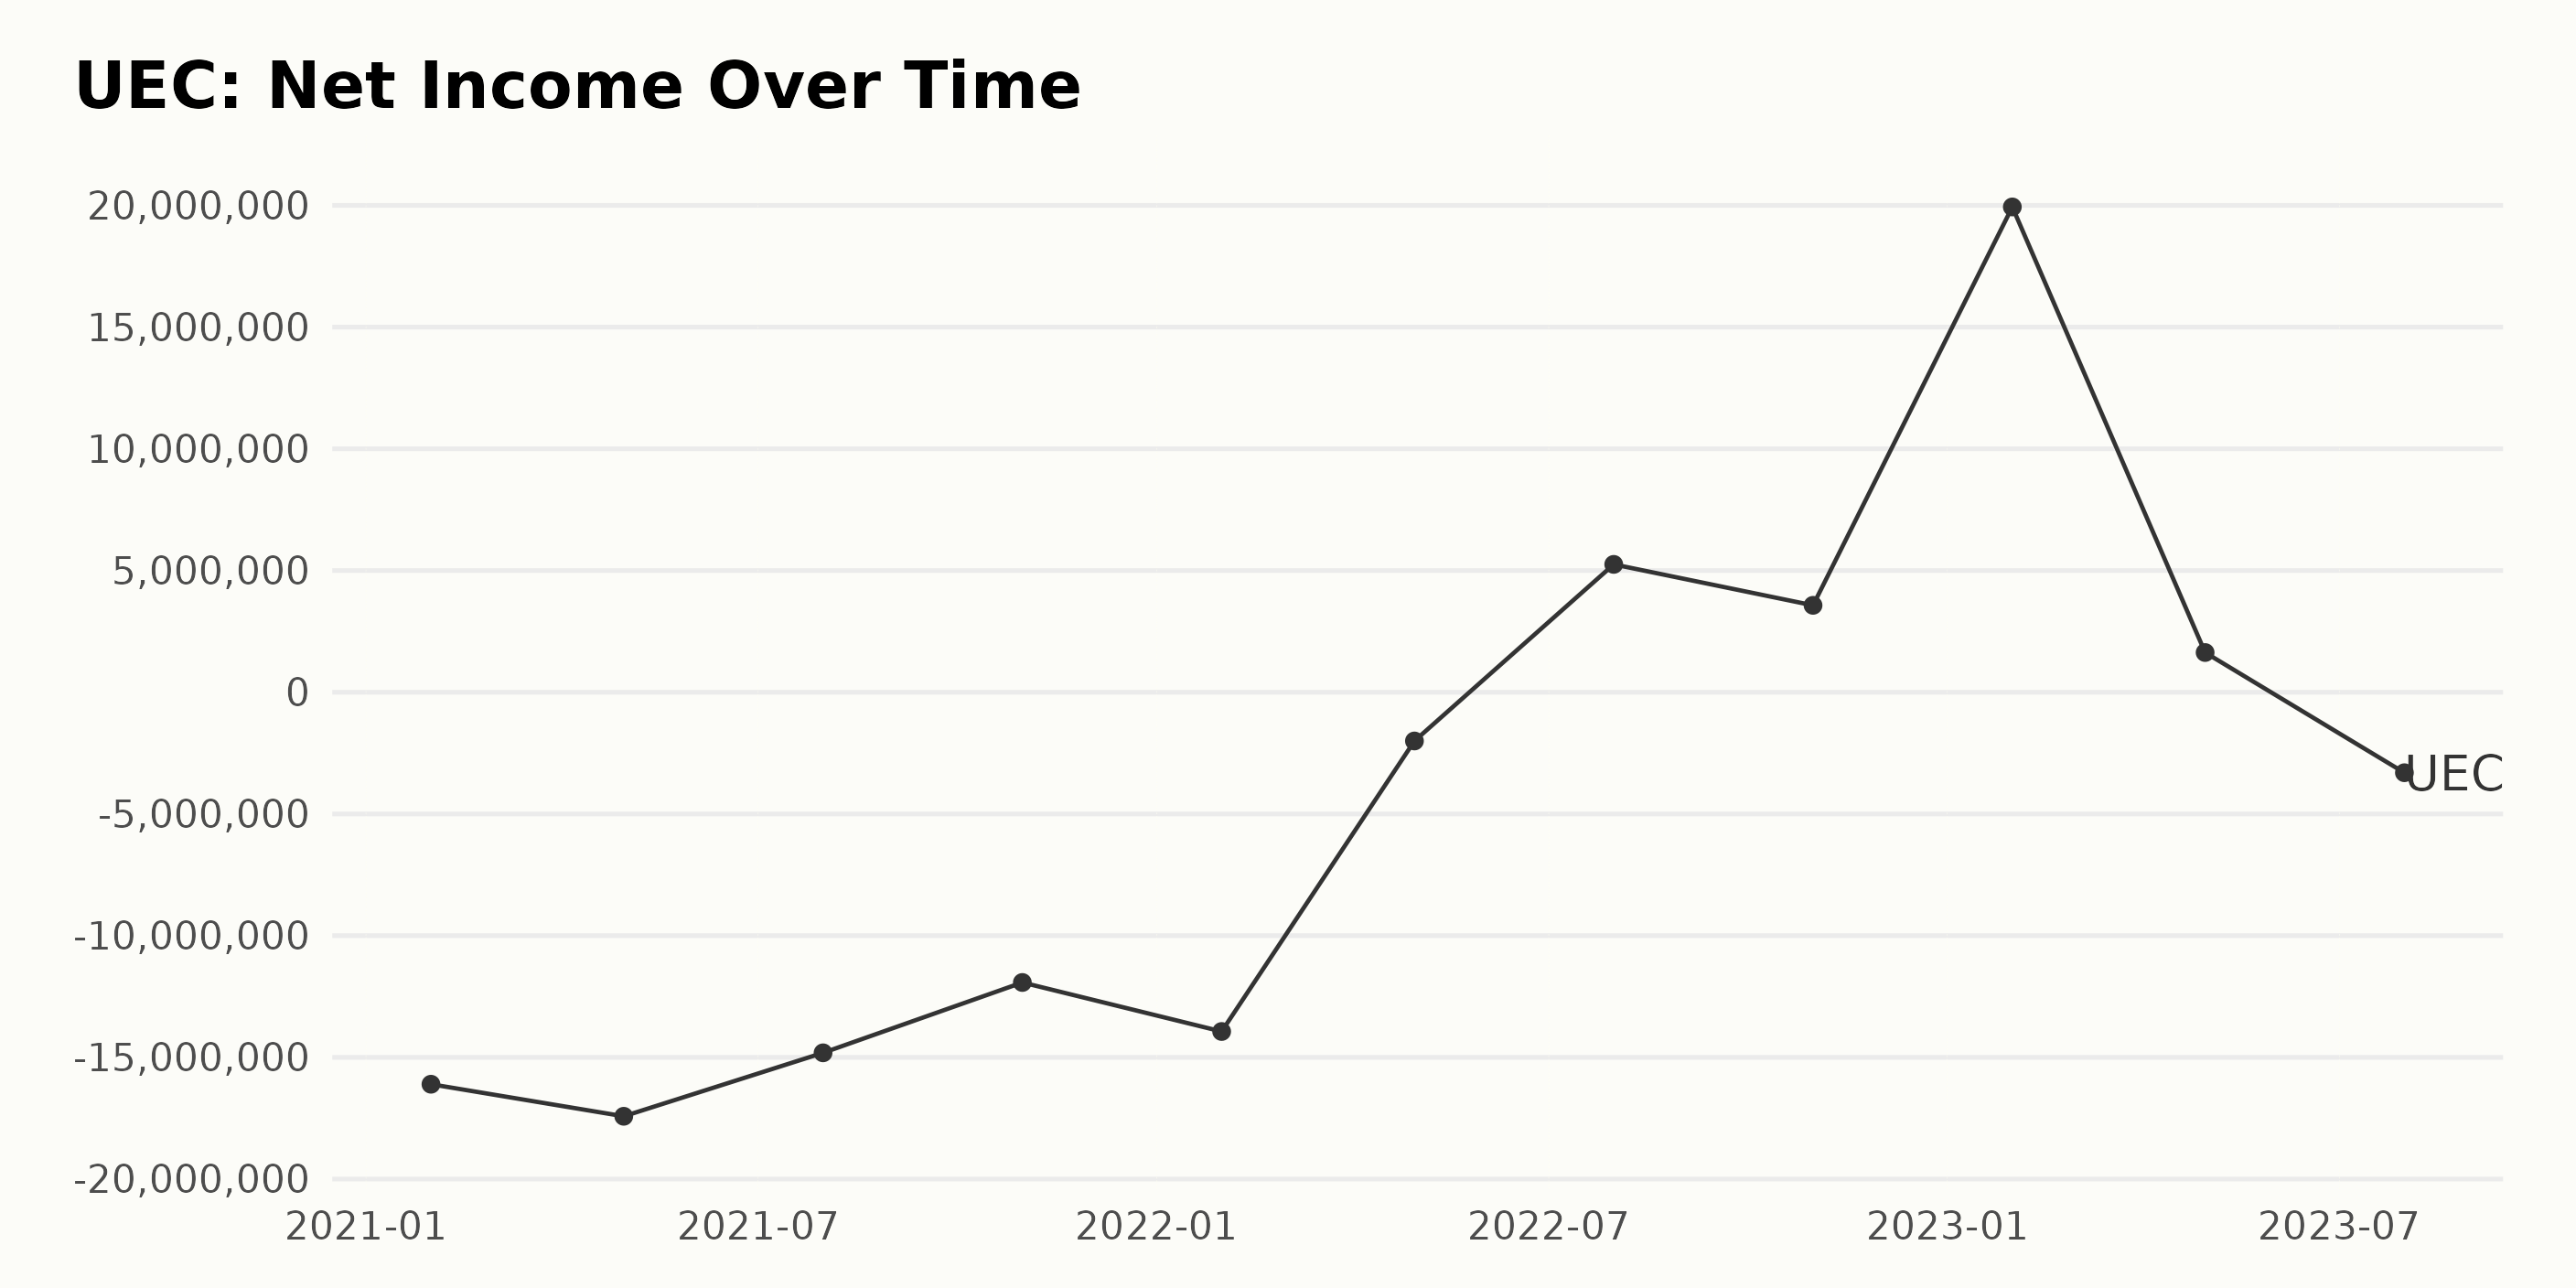
The trend and fluctuation of the trailing-12-month net income of UEC from January 2021 to July 2023 can be summarised as followed:
- In January 2021, UEC reported a Net Income of -$16.10 million. This negatively trended downward to -$17.42 million by April 2021. However, there was an improvement to -$14.81 million by July 2021.
- From there, the net income continued to increase to -$11.92 million in October 2021, and then a slight downtrend to -$13.94 million in January 2022.
- UEC saw a significant reduction in loss by April 2022, with the net income coming in at -$2 million. This upward trend continued further into July 2022 when UEC recorded a positive net income for the first time during this period: $5.25 million.
- Although there was a slight decline to $3.57 million in October 2022, an impressive leap was seen in January 2023 with a net income of $19.94.
- The following quarter witnessed a downturn, with net income dropping drastically to $1.63 million in April 2023.
- The most recent data, as of July 2023, shows a negative turn with a net income of -$3.3 million, marking the end of its previous short-lived positive trend.
On calculating the growth rate from the first value to the last, we observe a growth rate of approximately 20.5%. However, one should note that despite the overall positive growth rate, the latest trends from UEC show a return to the negative net income, and this might draw closer scrutiny in future observations.
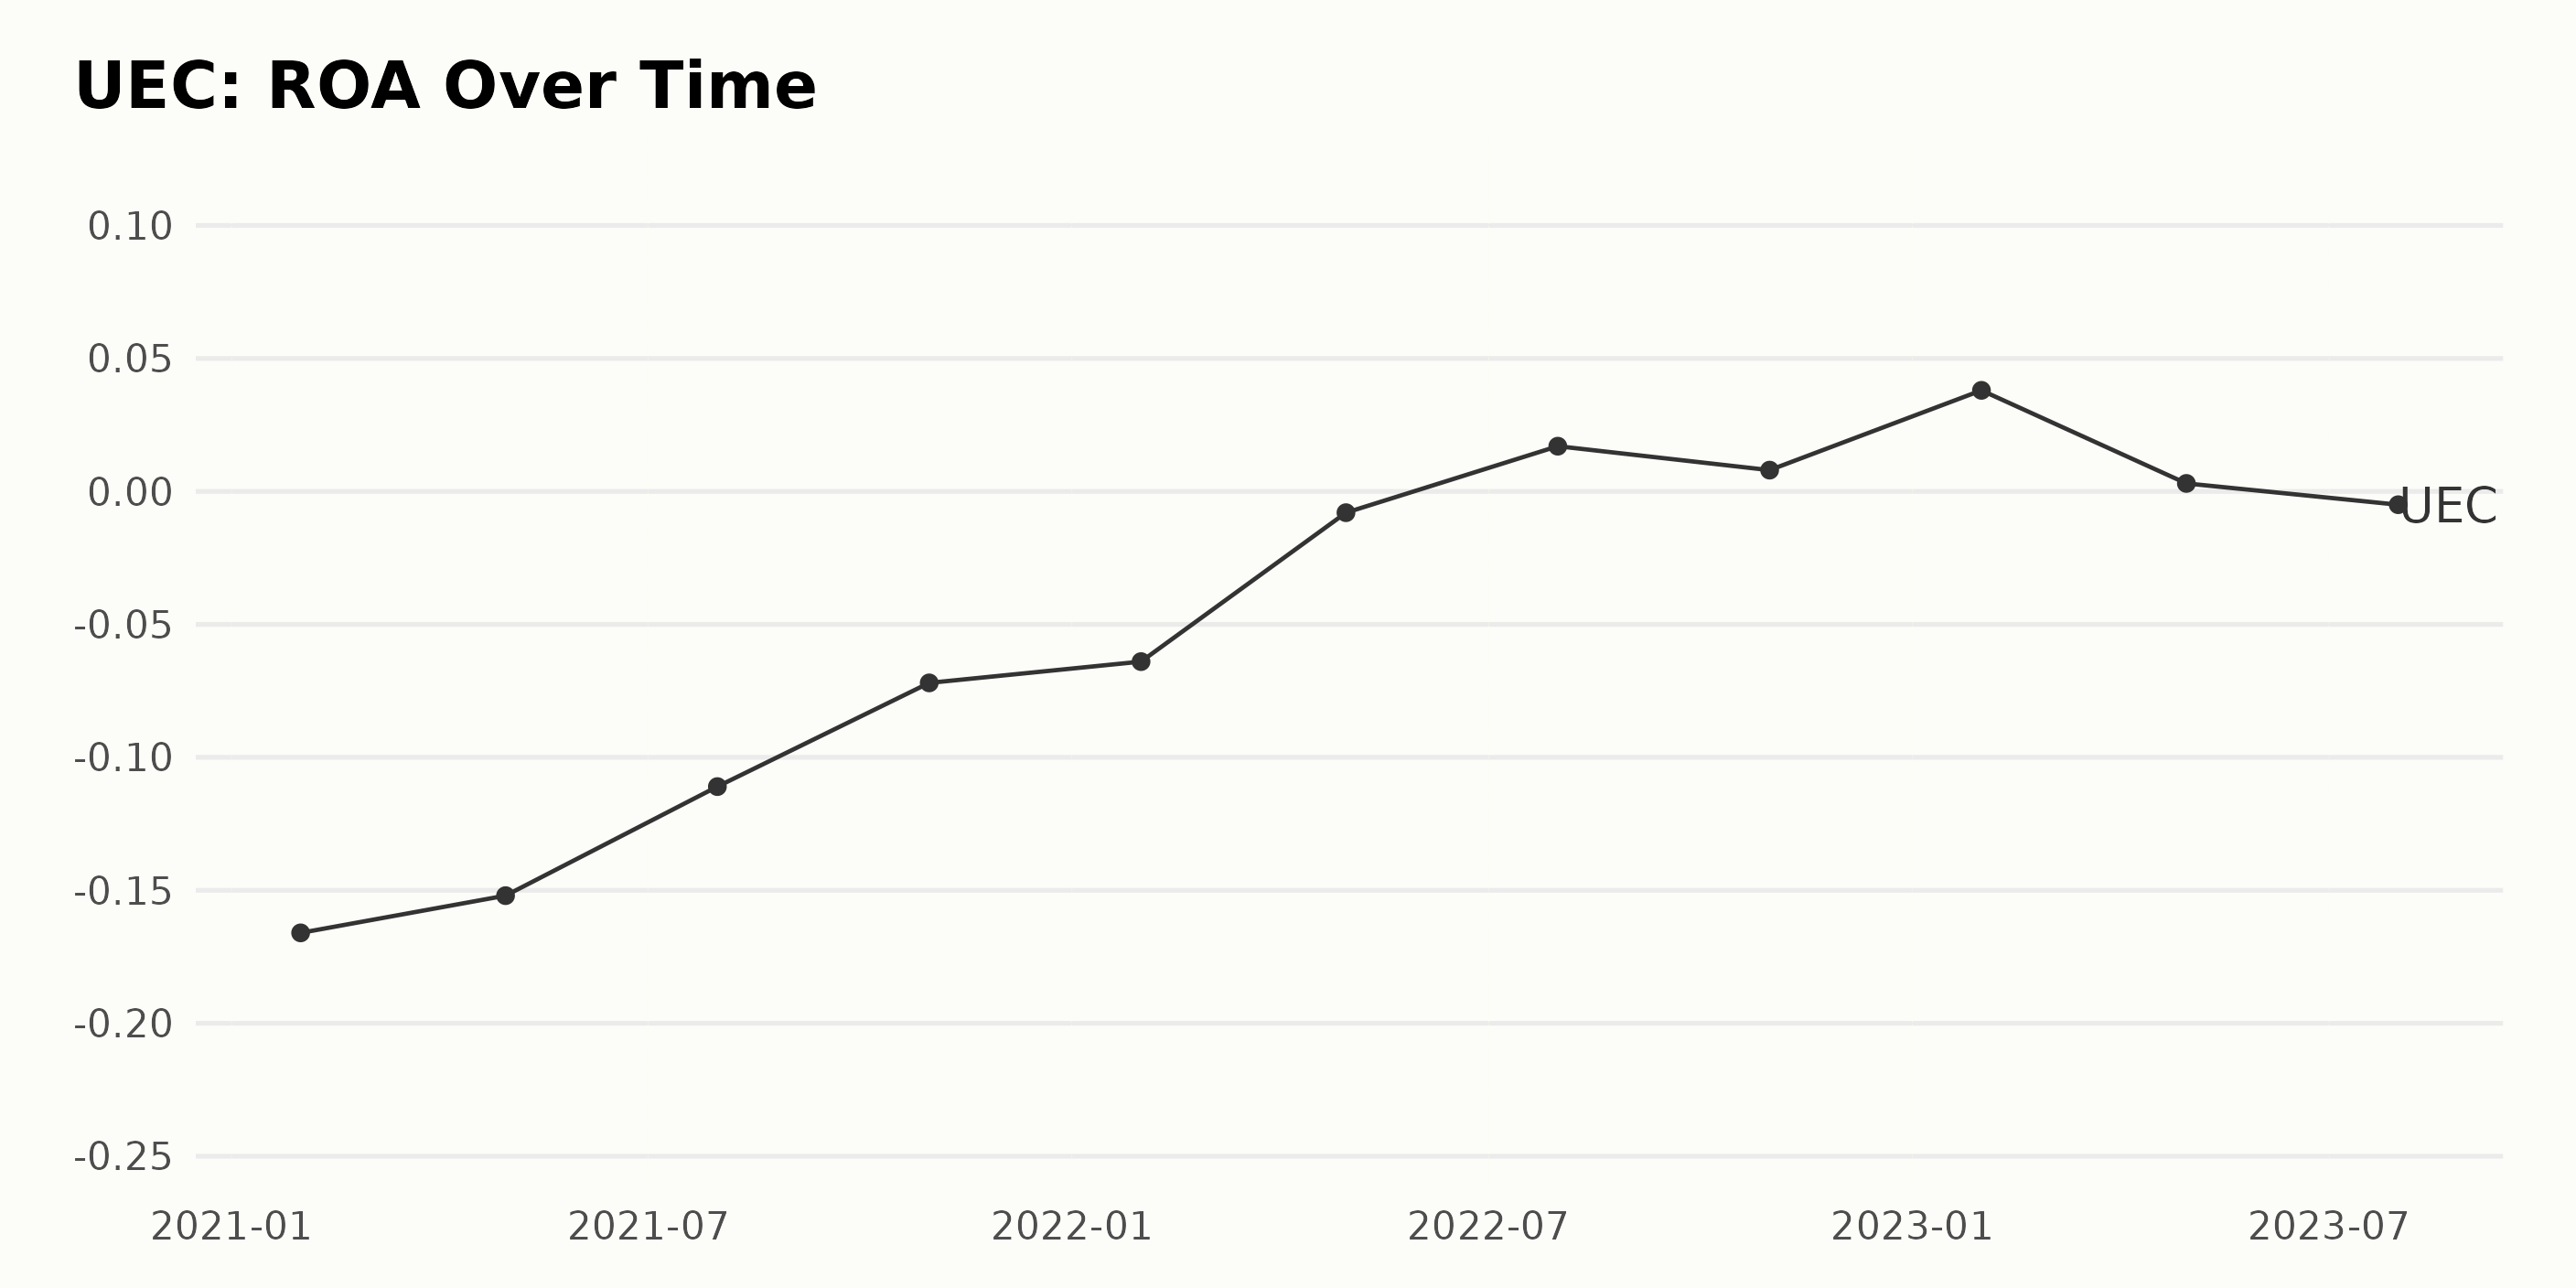
The Return on Assets (ROA) of UEC has displayed a fluctuating trend from January 2021 to July 2023. Here's the summarised analysis:
- The ROA started negatively at -16.6% in January 2021, and subsequently demonstrated a gradual improvement over the following four quarters.
- By the end of 2021, the negativity decreased with the value of ROA reaching -7.2% in October 2021.
- The most significant turnaround was seen by April 2022 when the negative trend shifted to a positive ROA of 0.017% in July 2022.
- However, the positive outcome was rather short-lived, as the ROA dipped again and reverted to negative -0.005% by July 2023. This period marked the lowest point for UEC's ROA since its positive phase in July 2022 with a significant drop from 0.038% in January 2023 to -0.005% in July 2023.
- The final recorded ROA in this series is -0.005%.
The overall growth rate from the first value to the last indicates that while the ROA improved from -16.6% to -0.005%, the trend was generally volatile. It suggests a recurring challenge to maintain consistent profitability despite some temporary periods of positive performance.
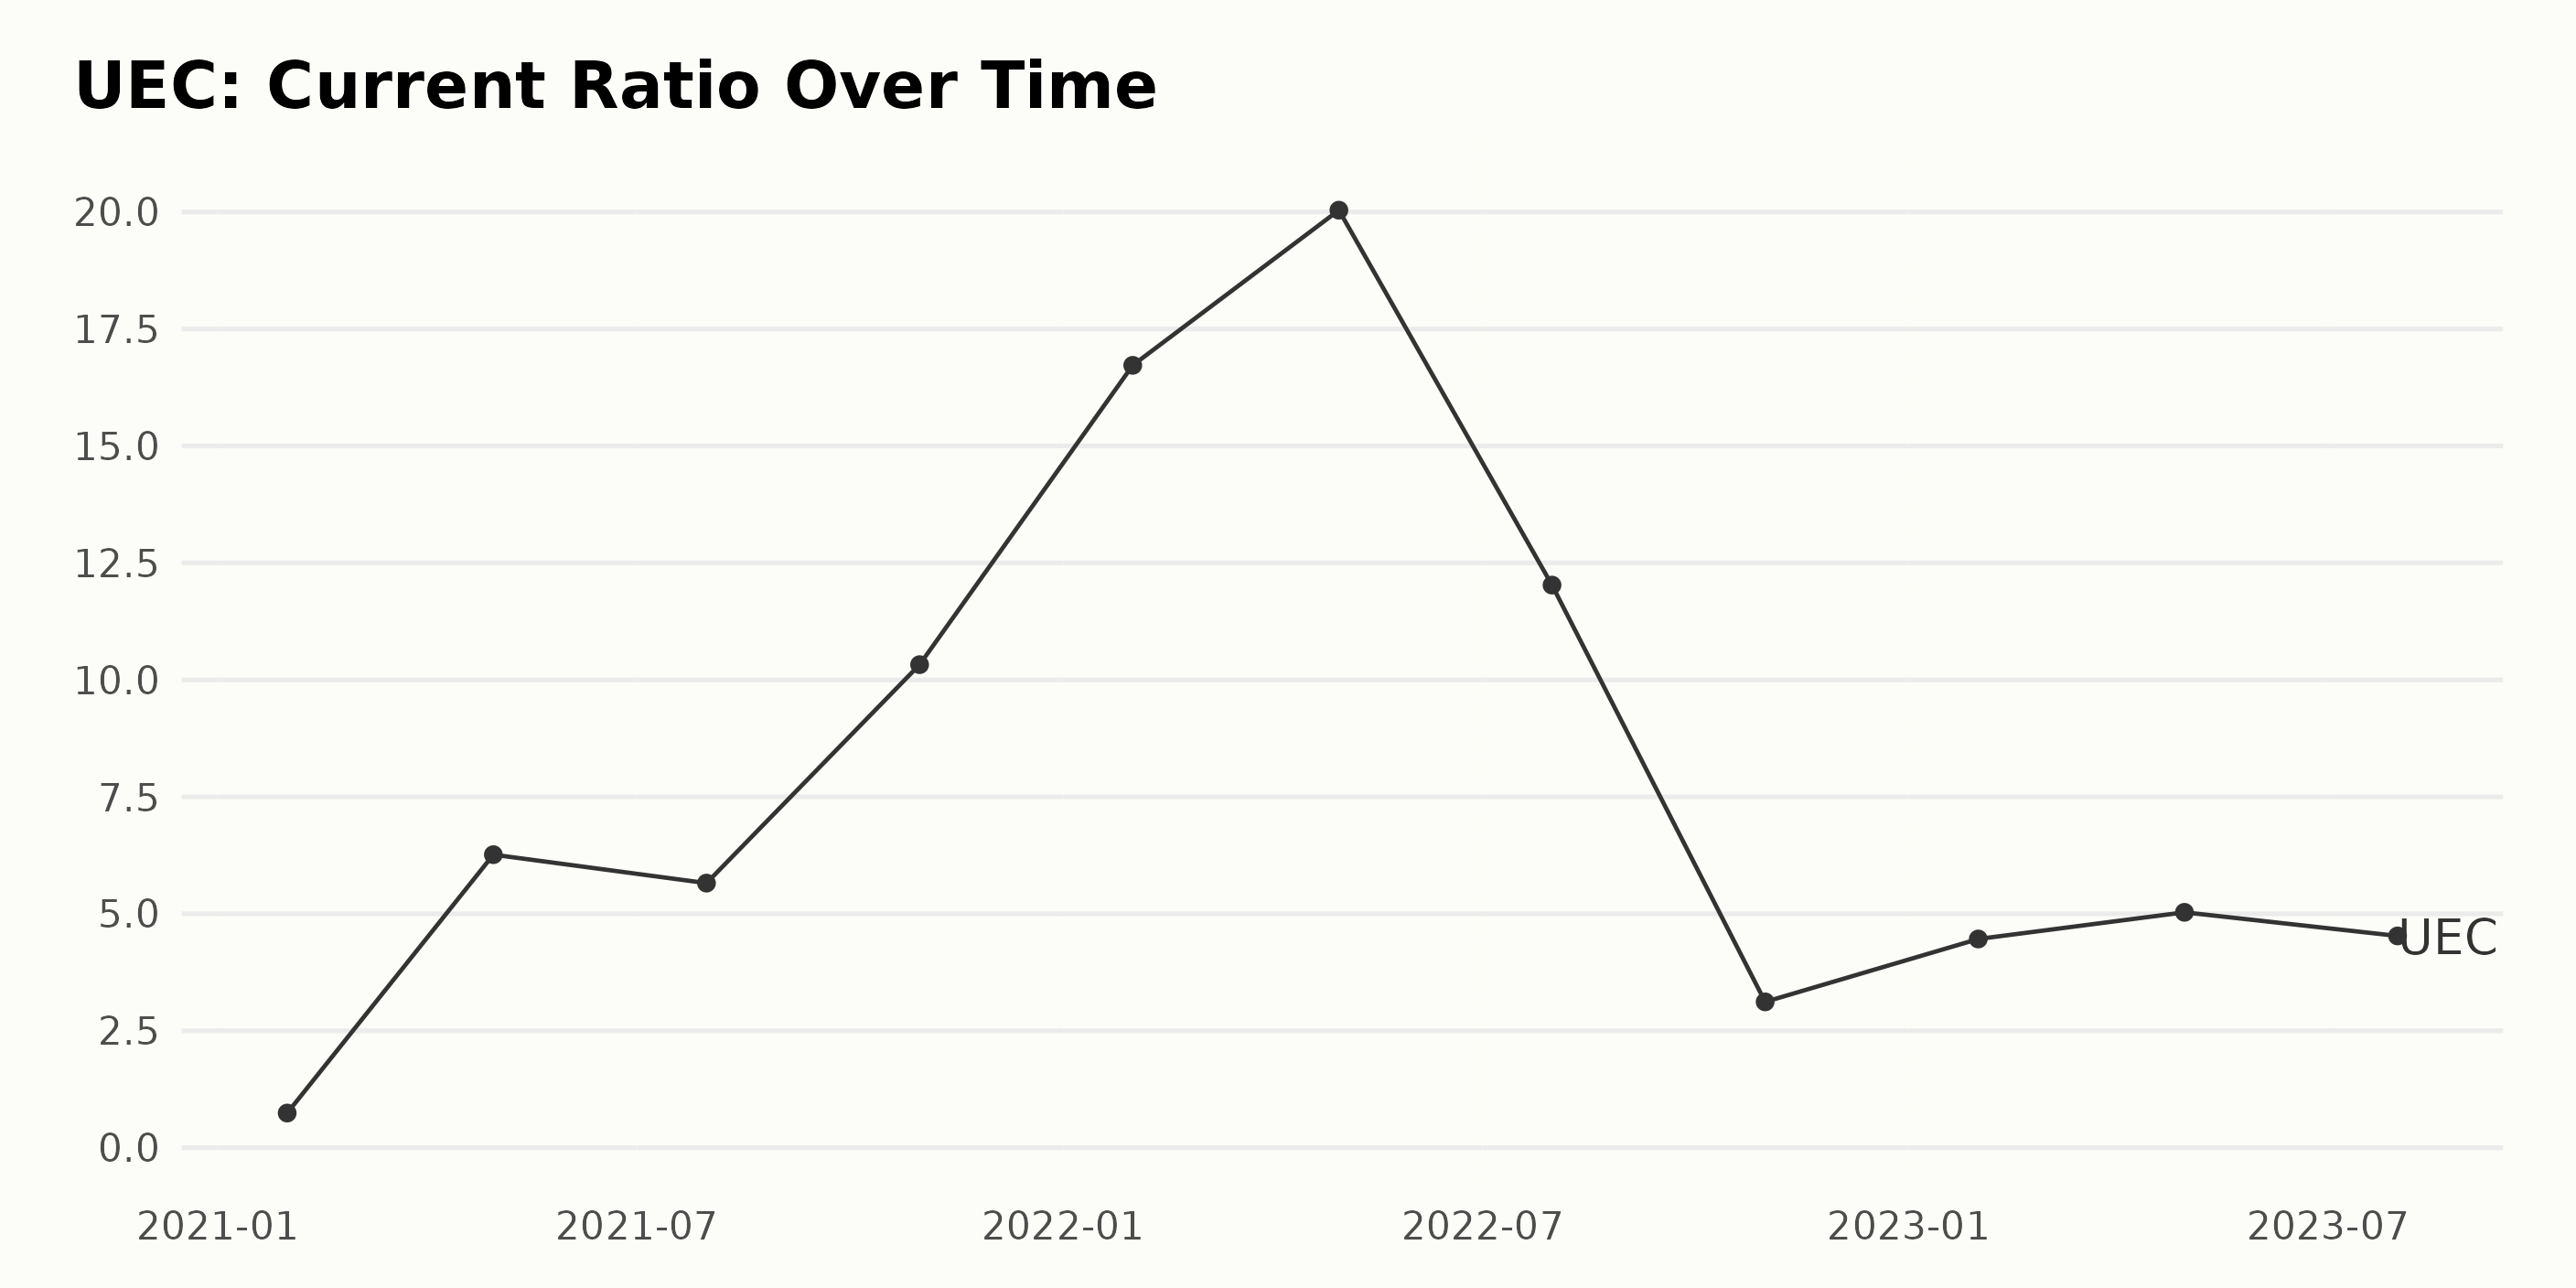
The Current Ratio for UEC displays several trends and fluctuations over time:
- In January 2021, the value of the Current Ratio was 0.74, marking the starting point in the data series. From January 2021 to April 2021, there was a significant increase to a Current Ratio of 6.26.
- Following this, a slight drop occurred to 5.66 in July 2021.
- The highest peak in the series was in April 2022 when the Current Ratio reached 20.04, showing drastic growth over a period.
- Post-April 2022, the Current Ratio experienced a steep decrease down to 3.12 by October 2022, the lowest point since April 2021.
- Progressing into 2023, the Current Ratio shows a gradual uptick again, reaching 5.03 by April 2023. However, it fell slightly to 4.53 by July 2023, showing the most recent trend.
The overall growth of the Current Ratio from January 2021 to July 2023 is an increase of 3.78 units, indicating that despite the fluctuations over time, there's still an upwards trend.
Emphasis on the last value in this series, which is 4.53 as of July 2023, suggests a downward fluctuation when compared to previous months in 2023. This may indicate potential risks or changing circumstances and should be closely monitored.
Uranium Energy Corp. Stock Analysis: A Rising Trend with Late Deceleration in 2023
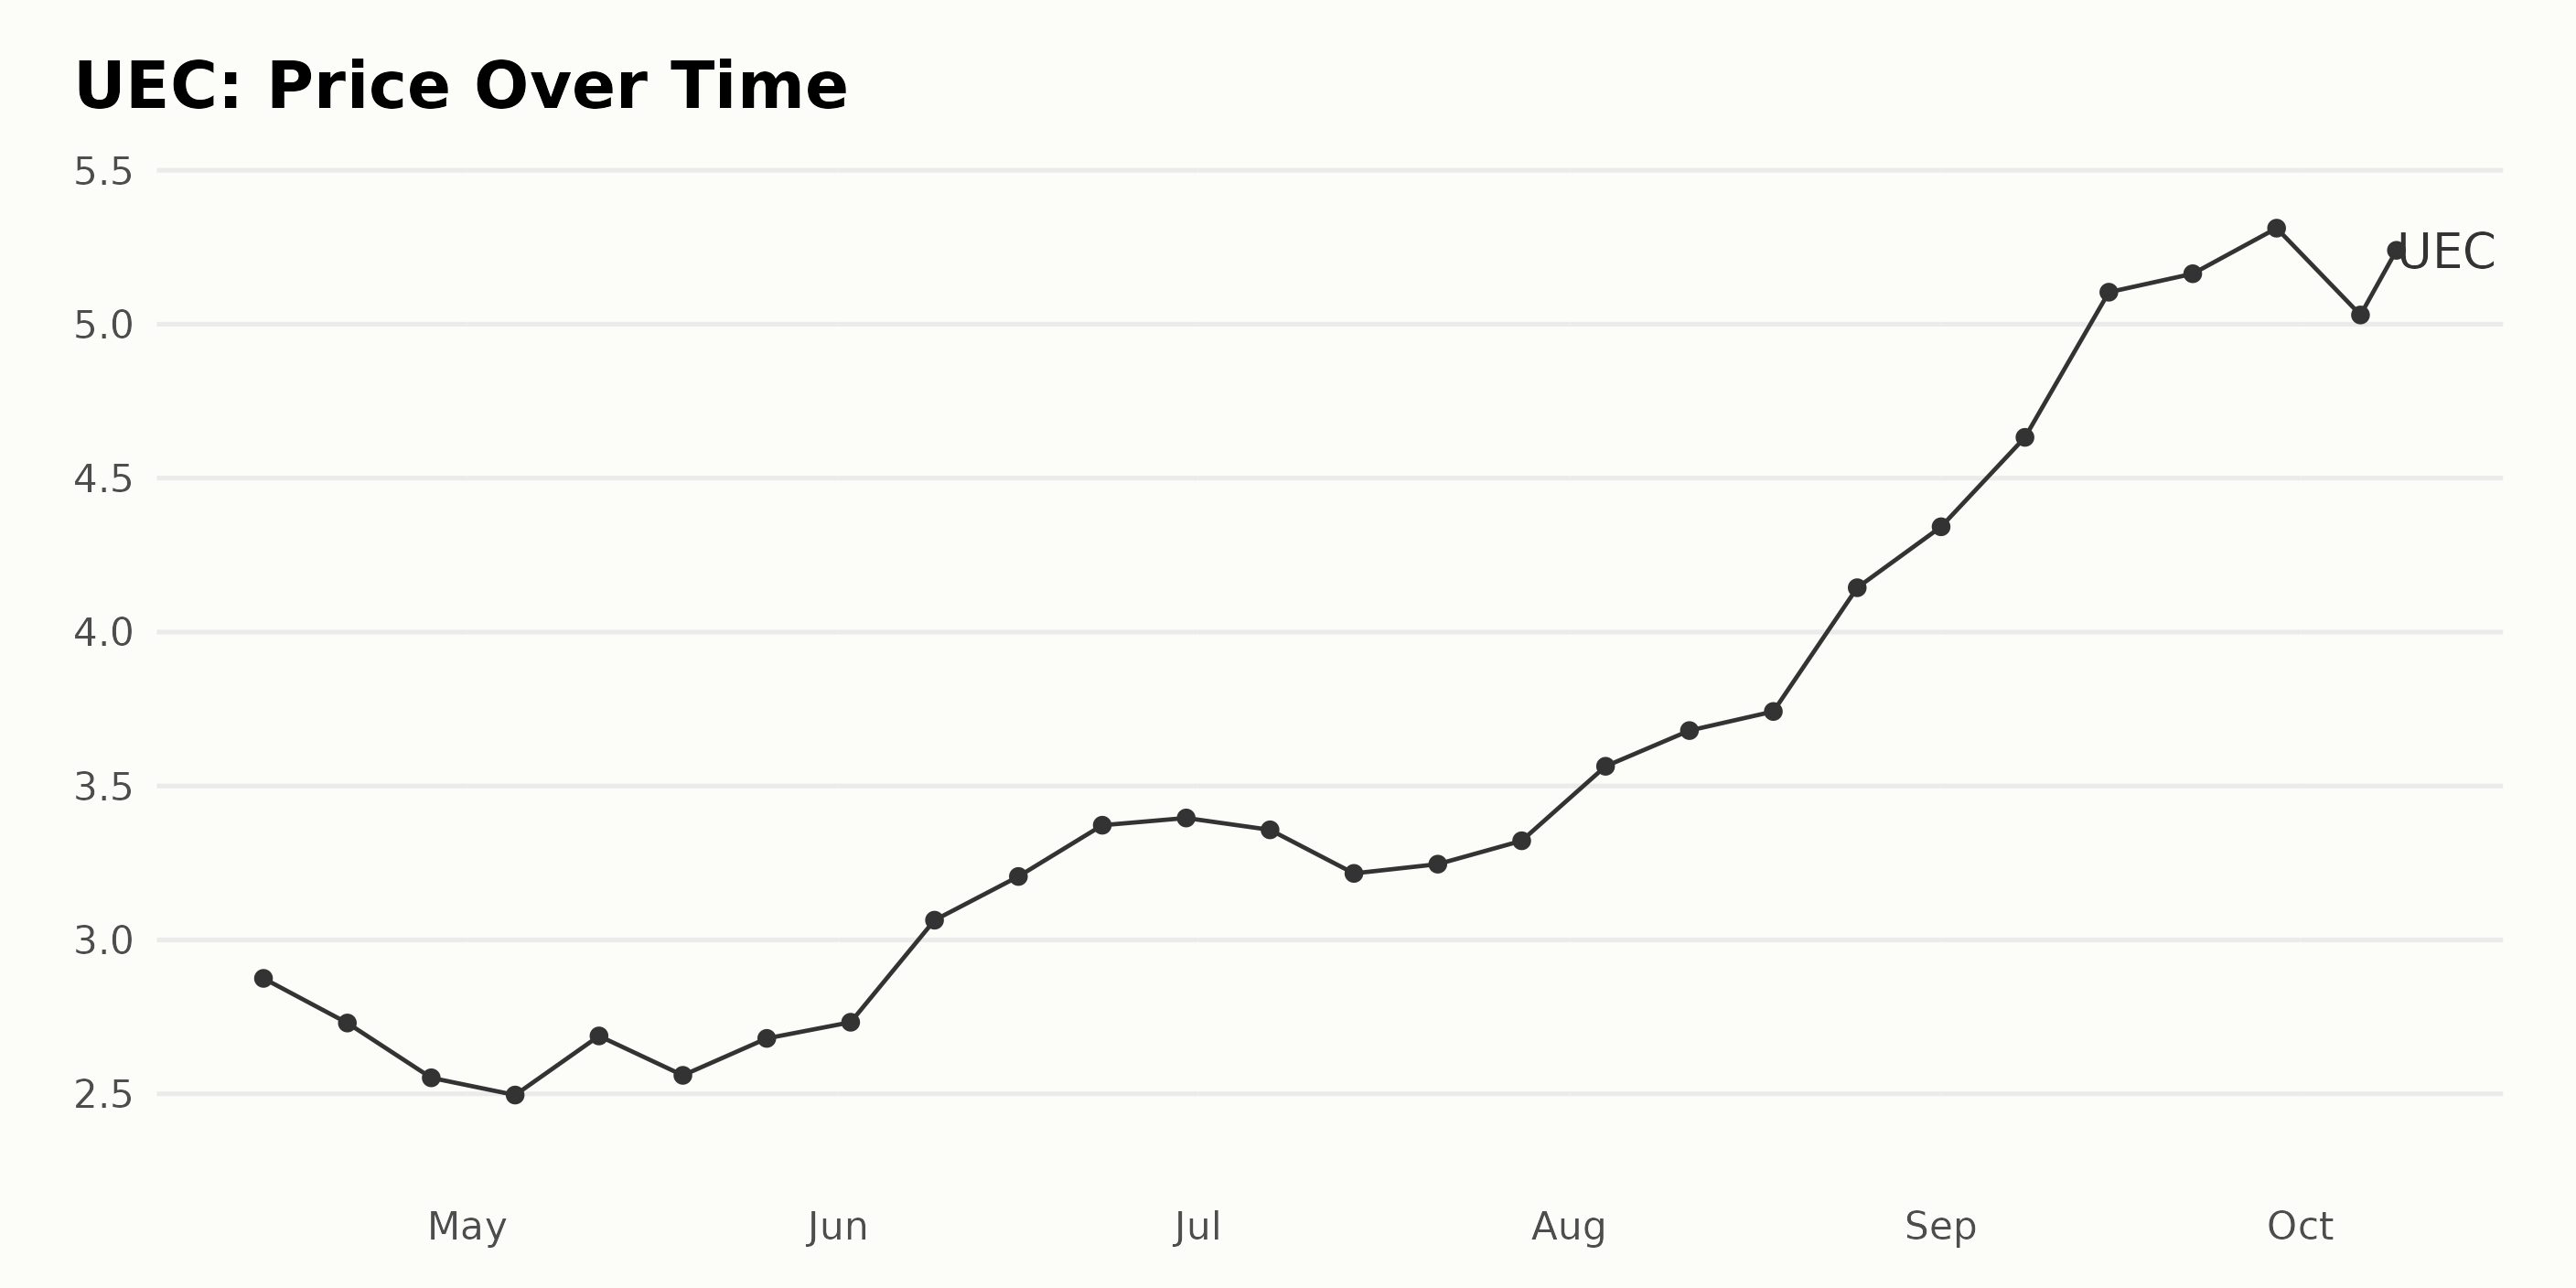
The data for UEC’s share prices from April 2023 to October 2023 indicates a clear increasing trend in the share prices with some deceleration in the latter half of the period. Here are the key data points:
- April 14, 2023: $2.88
- April 21, 2023: $2.73
- April 28, 2023: $2.55
- May 5, 2023: $2.50
- May 12, 2023: $2.69
- May 19, 2023: $2.56
- May 26, 2023: $2.68
- June 2, 2023: $2.73
- June 9, 2023: $3.06
- June 16, 2023: $3.21
- June 23, 2023: $3.37
- June 30, 2023: $3.40
- July 7, 2023: $3.36
- July 14, 2023: $3.22
- July 21, 2023: $3.25
- July 28, 2023: $3.32
- August 4, 2023: $3.56
- August 11, 2023: $3.68
- August 18, 2023: $3.74
- August 25, 2023: $4.14
- September 1, 2023: $4.34
- September 8, 2023: $4.63
- September 15, 2023: $5.10
- September 22, 2023: $5.16
- September 29, 2023: $5.31
- October 6, 2023: $5.03
- October 9, 2023: $5.24
From these data points, it can be seen that the share price starts increasing from June and continues to grow until mid-September. After reaching a peak of $5.31 at the end of September, there is a slight drop in October, indicating a deceleration in the growth rate toward the end of this period. Overall, the share prices have increased significantly over the period from $2.88 in April to $5.24 in October 2023, showing an upward trend with a decelerating growth rate at the end. Here is a chart of UEC's price over the past 180 days.
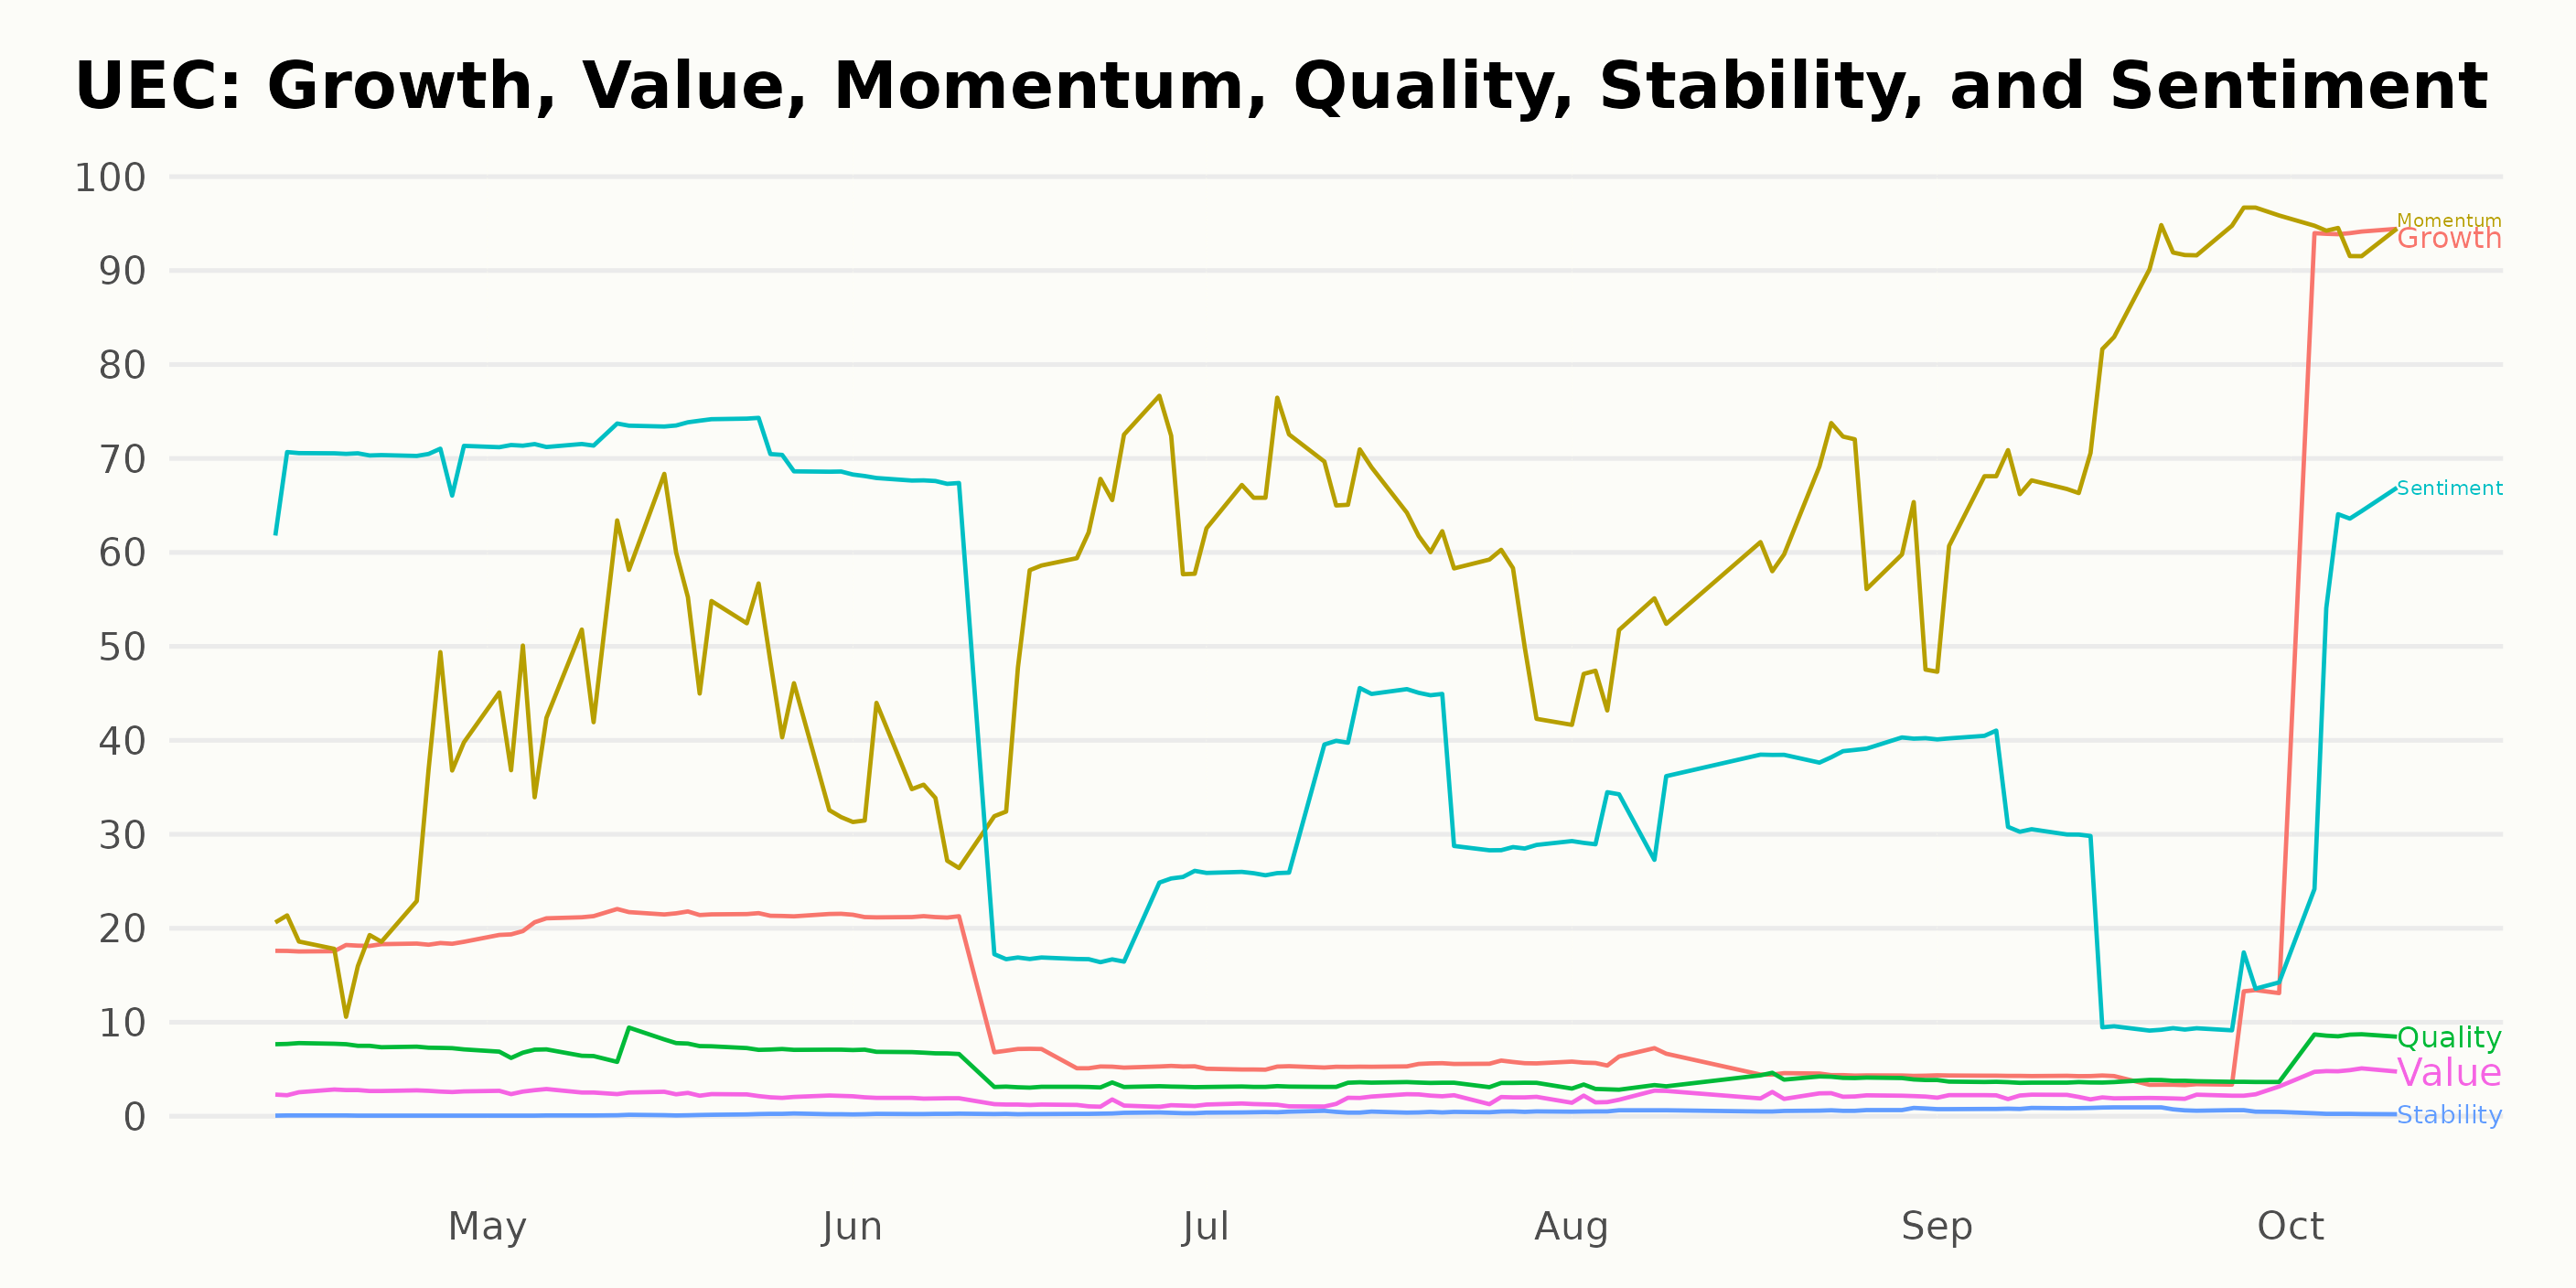
Analyzing Momentum, Growth, and Sentiment Trends in Uranium Energy Corp. Ratings
UEC has an overall D rating, translating to a Sell in our POWR Ratings system. It is ranked #29 out of the 32 stocks in the Industrial - Metals category.
Upon analysis of the POWR Ratings for UEC, three dimensions stand out in terms of their highest ratings and clear trends. These dimensions are Momentum, Growth, and Sentiment.
Momentum: The momentum dimension showed a consistent increase from April to October 2023. Starting at a rating of 25 on April 29, 2023, the value gradually rose to an impressive rating of 94 by October 10, 2023.
Growth: The growth dimension experienced fluctuations starting from April 29, 2023, with significant growth in October 2023. The growth rating increased from 18 in April to 94 in October 2023, highlighting a positive trend in this dimension.
Sentiment: For the sentiment dimension, a sizable dip was identified from May until September 2023, after which there was a recovery. The sentiment rating began as 70 in April, reducing to 22 by September 30, 2023, before rebounding to 56 by October 10, 2023.
Please note that these dimensions were identified as the most noteworthy based on their highest ratings and clear trends over the specified period.
Stocks to Consider Instead of Uranium Energy Corp. (UEC)
Other stocks in the Industrial - Metals sector that may be worth considering are Gibraltar Industries, Inc. (ROCK), BHP Billiton Limited (BHP), and Anglo American PLC (NGLOY) -- they have better POWR Ratings.
What To Do Next?
Discover 10 widely held stocks that our proprietary model shows have tremendous downside potential. Please make sure none of these “death trap” stocks are lurking in your portfolio:
UEC shares were trading at $5.39 per share on Tuesday afternoon, up $0.10 (+1.89%). Year-to-date, UEC has gained 38.92%, versus a 15.02% rise in the benchmark S&P 500 index during the same period.
About the Author: Subhasree Kar

Subhasree’s keen interest in financial instruments led her to pursue a career as an investment analyst. After earning a Master’s degree in Economics, she gained knowledge of equity research and portfolio management at Finlatics.
The post Uranium Energy (UEC): Is There Potential Growth for This Uranium Stock? appeared first on StockNews.com