
Despite Hurricane Idalia’s impact, record travel was expected during the Labor Day weekend. The pent-up travel demand is also impacting travel volume. According to the Federal Aviation Administration, more than 250,000 flights were scheduled through Tuesday.
United Airlines Holdings, Inc. (UAL) stands to benefit from the Labor Day rush. The company recorded a total operating revenue of $14.18 billion for the second quarter, up 17.1% year-over-year. Moreover, its adjusted EPS improved by 251.7% from the year-ago value to $5.03.
On the other hand, the company’s ambiguous profitability scenario is concerning. Its trailing-12-month EBITDA margin of 15.17% is 11.4% higher than the industry average of 13.62%, while its trailing-12-month levered FCF margin of 0.64% is 88.2% lower than the 5.41% industry average.
Given this backdrop, let’s look at the trends of UAL’s key financial metrics to understand why it could be wise to watch and wait for a better entry point in the stock.
Examining United Continental Holdings, Inc.'s Financial Performance: 2020-2023 Trends and Fluctuations
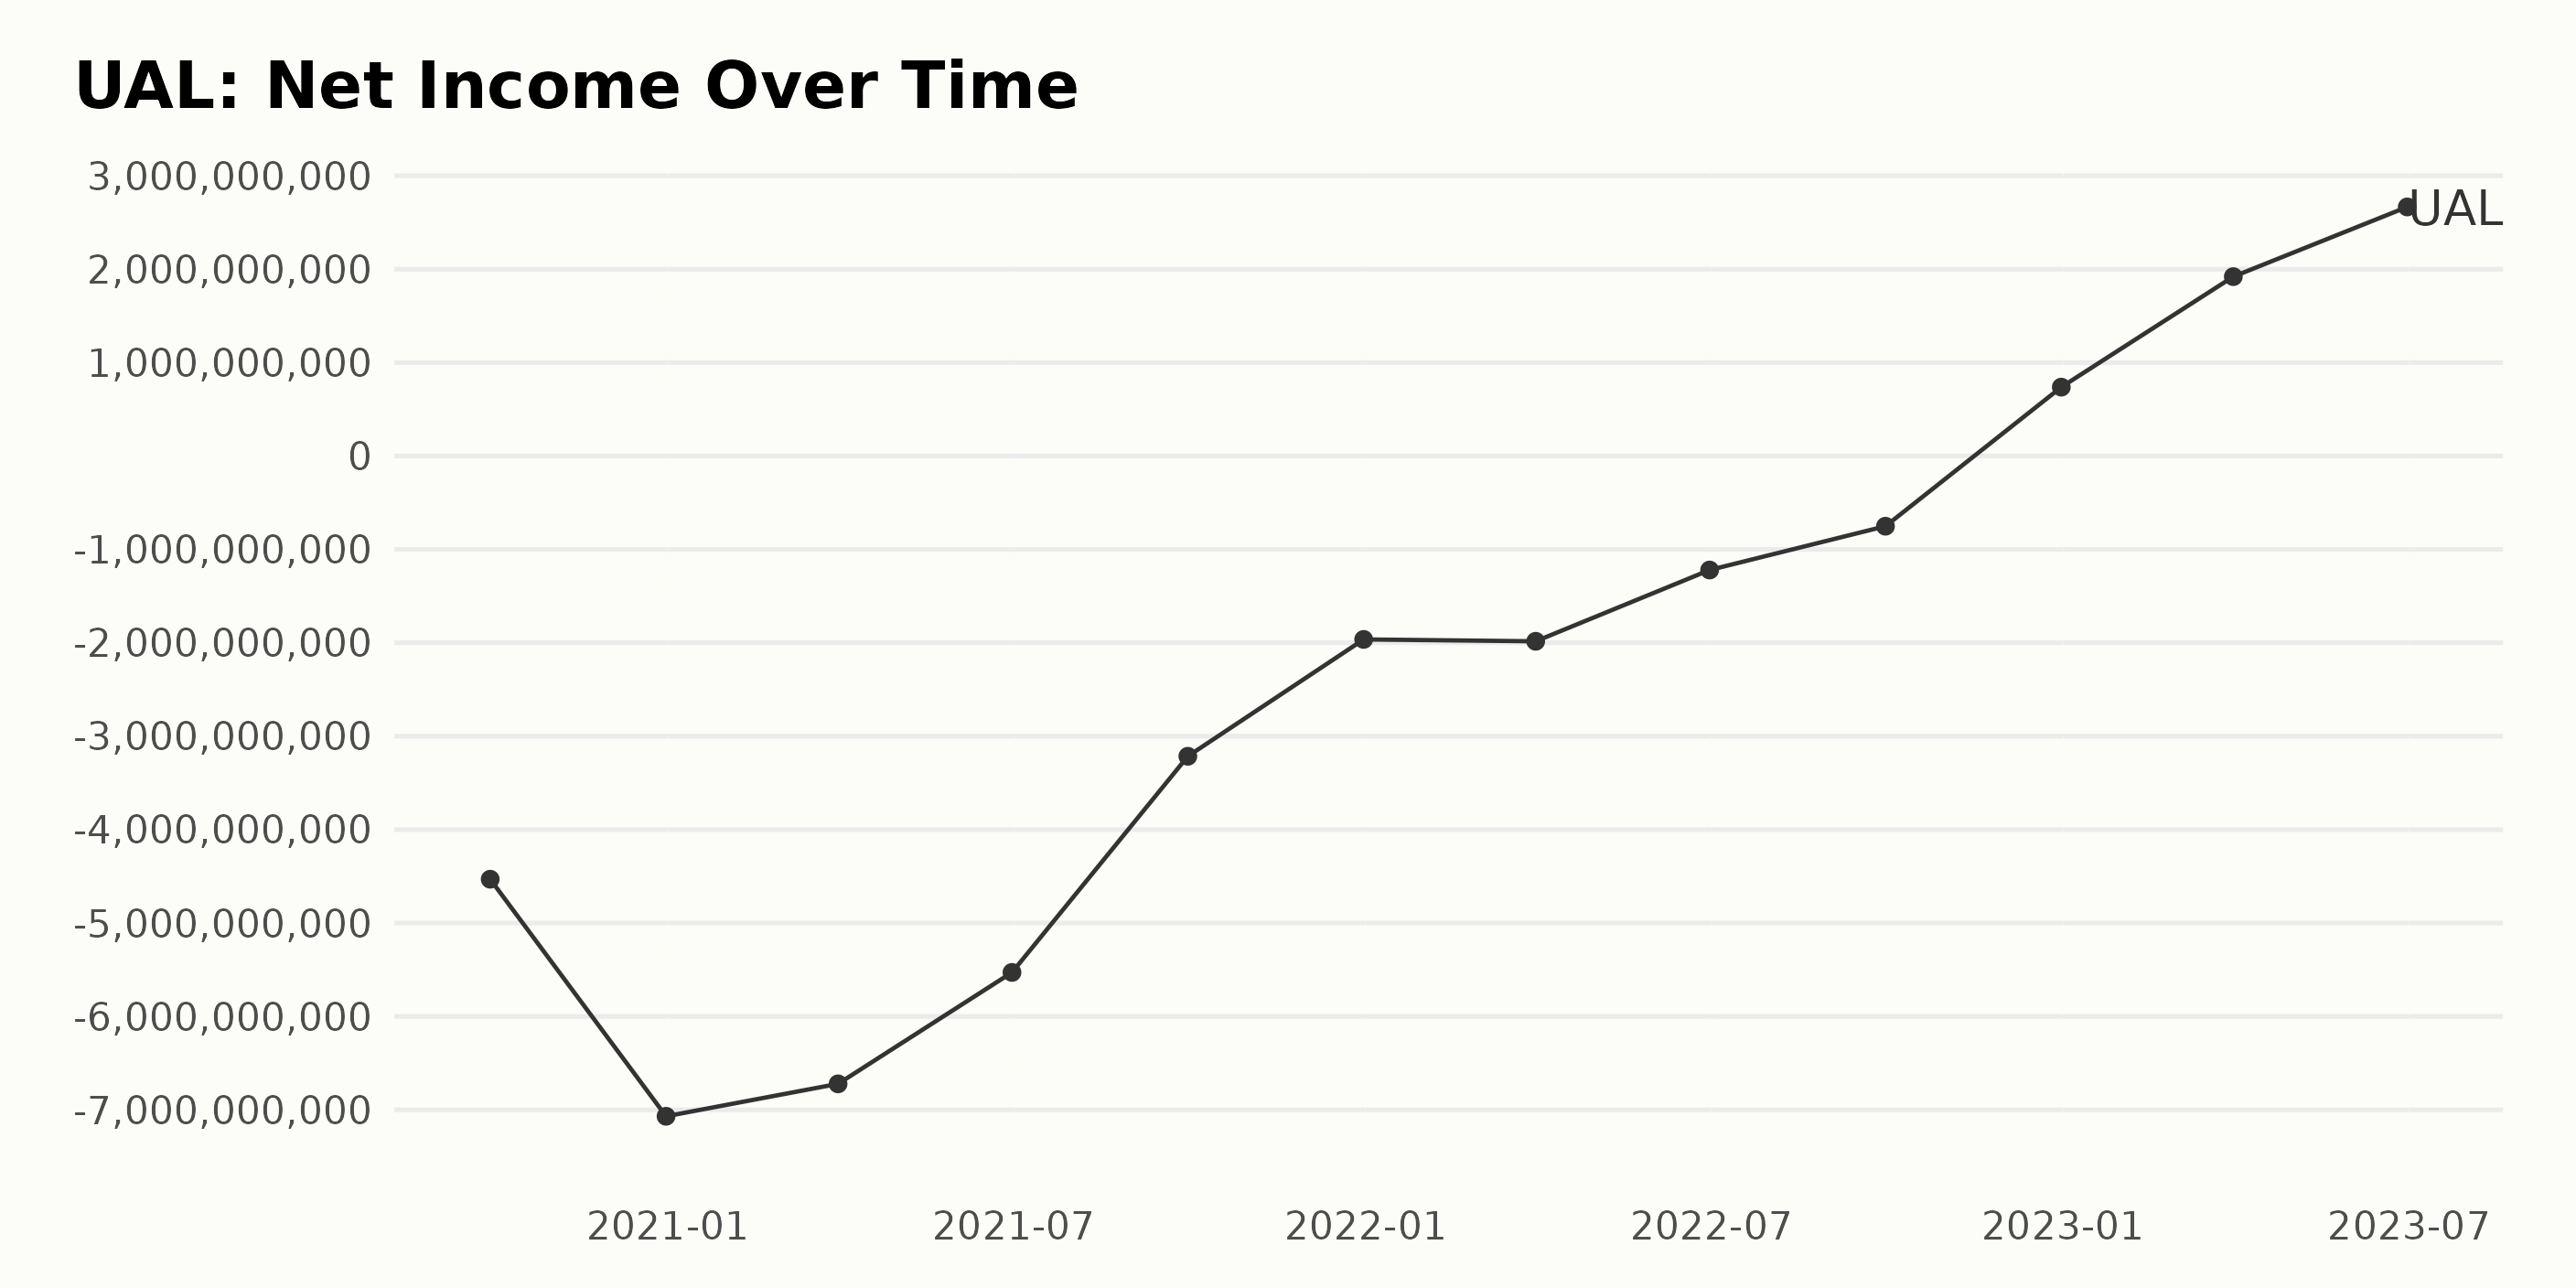
The trend and fluctuations in the trailing-12-month net income of UAL are as follows:
- On September 30, 2020, UAL reported a net income of -$4.53 billion.
- The net income further decreased to -$7.07 billion by December 31, 2020.
- UAL's net income showed minor fluctuations with a figure of -$6.72 billion and -$5.53 billion for March 31, 2021, and June 30, 2021, respectively.
- On September 30, 2021, the net income reduced to -$3.22 billion, showing a decreasing negative trend.
- The year 2022 saw an initial net income of -$1.96 billion as of December 31, 2021, and -$1.98 billion as of March 31, 2022.
- There was a slight improvement by June 30, 2022, with the net income reported at -$1.22 billion.
- The third quarter of 2022 brought a significant reduction in losses, with the net income at -$752 million by September 30, 2022.
- By the end of the year, on December 31, 2022, UAL reported a positive net income of $737 million, marking a significant return to profitability.
- The growth continued into 2023, with the company reporting a net income of $1.92 billion and $2.67 billion for the first and second quarters, respectively.
In summary, UAL's net income experienced substantial fluctuations over the period from the third quarter of 2020 through the second quarter of 2023. Initially, there were significant losses, reaching a low point in the fourth quarter of 2020.
However, the financial performance gradually improved, with the losses narrowing appreciably until the end of 2022, which marked a return to profitability. This growth trend continued into the first half of 2023, making it the most profitable period within this timeframe.
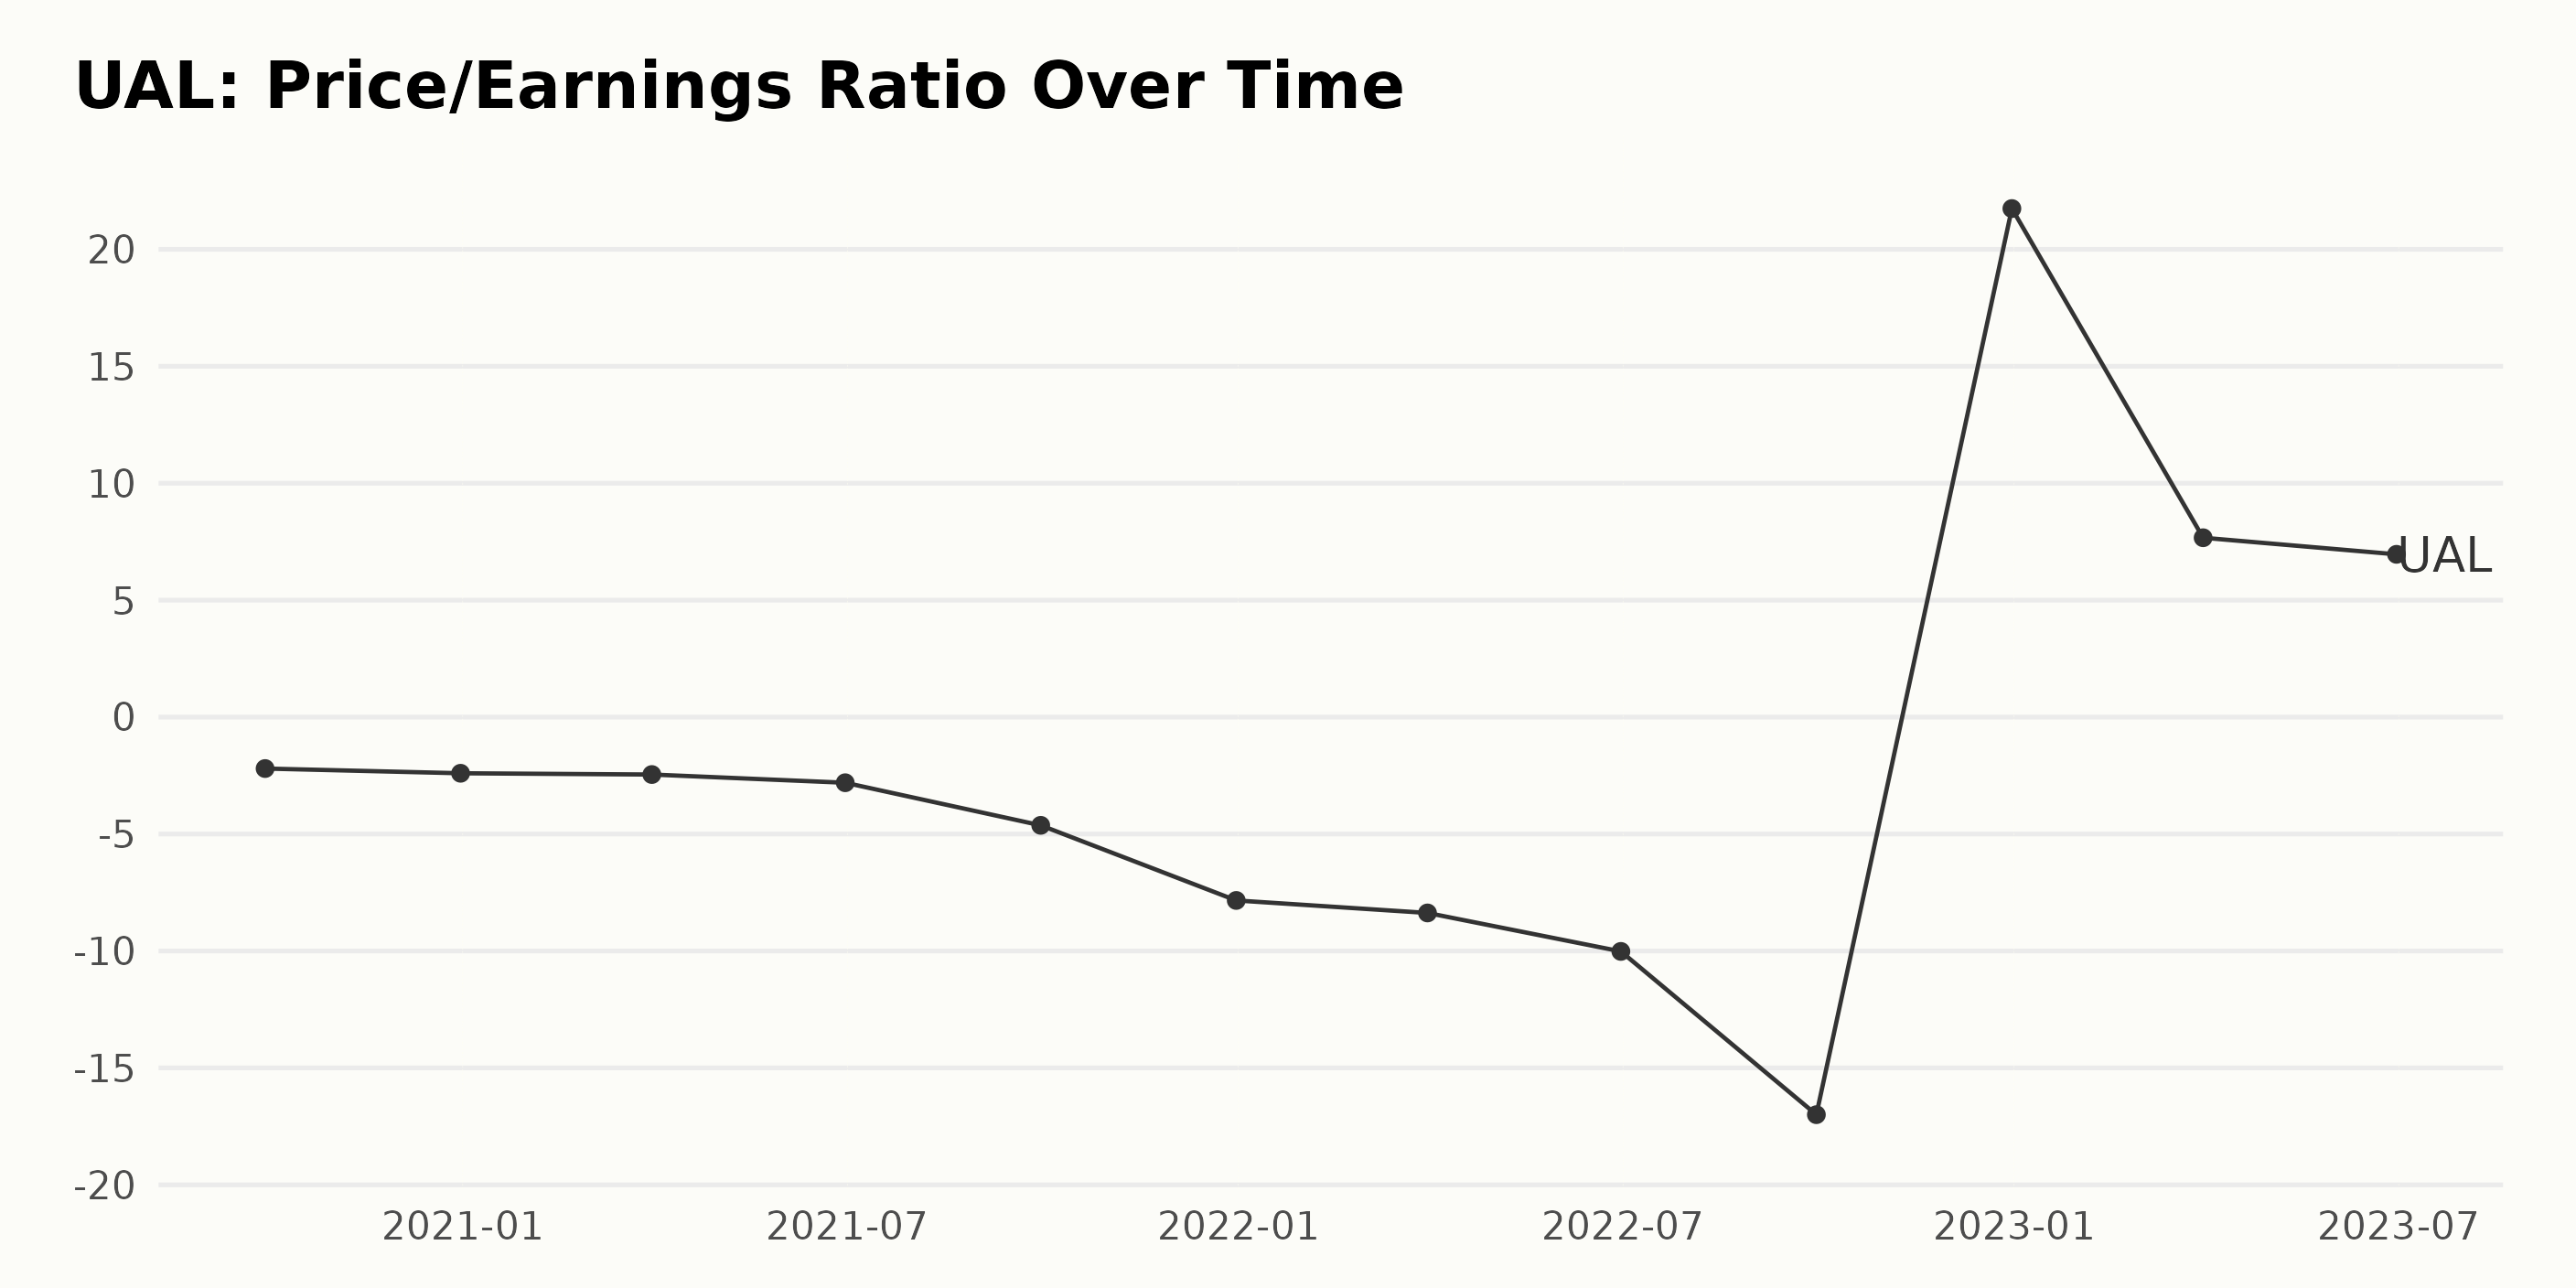
The Price/Earnings ratio (P/E) of UAL displays a generally declining trend with significant fluctuations over the time period provided.
- As of end-September 2020, the P/E ratio stood at -2.2.
- A steady decrease in the P/E ratio was observed over the course of 2021 and the first three quarters of 2022, where it hit a minimum of -17.0 in September 2022.
- The most drastic alteration in the ratio can be seen in the transition from the last quarter of 2022 to the first quarter of 2023, where P/E went up from -17.0 to 21.74.
- A decline is observed again during the first and second quarters of 2023, with the values ending at 6.96 in June 2023.
The P/E ratio has shown negative growth from the beginning to the end of the series. The initial value was -2.2, recorded on September 30, 2020, and the final value was 6.96, documented on June 30, 2023.
Despite fluctuations and an overall negative trend initially, the data indicates a positive change in the past two-quarters of the series, hinting at an improving earnings scenario for UAL. However, as current values are still less than the initial point, further investigation is suggested for precise causative insights.
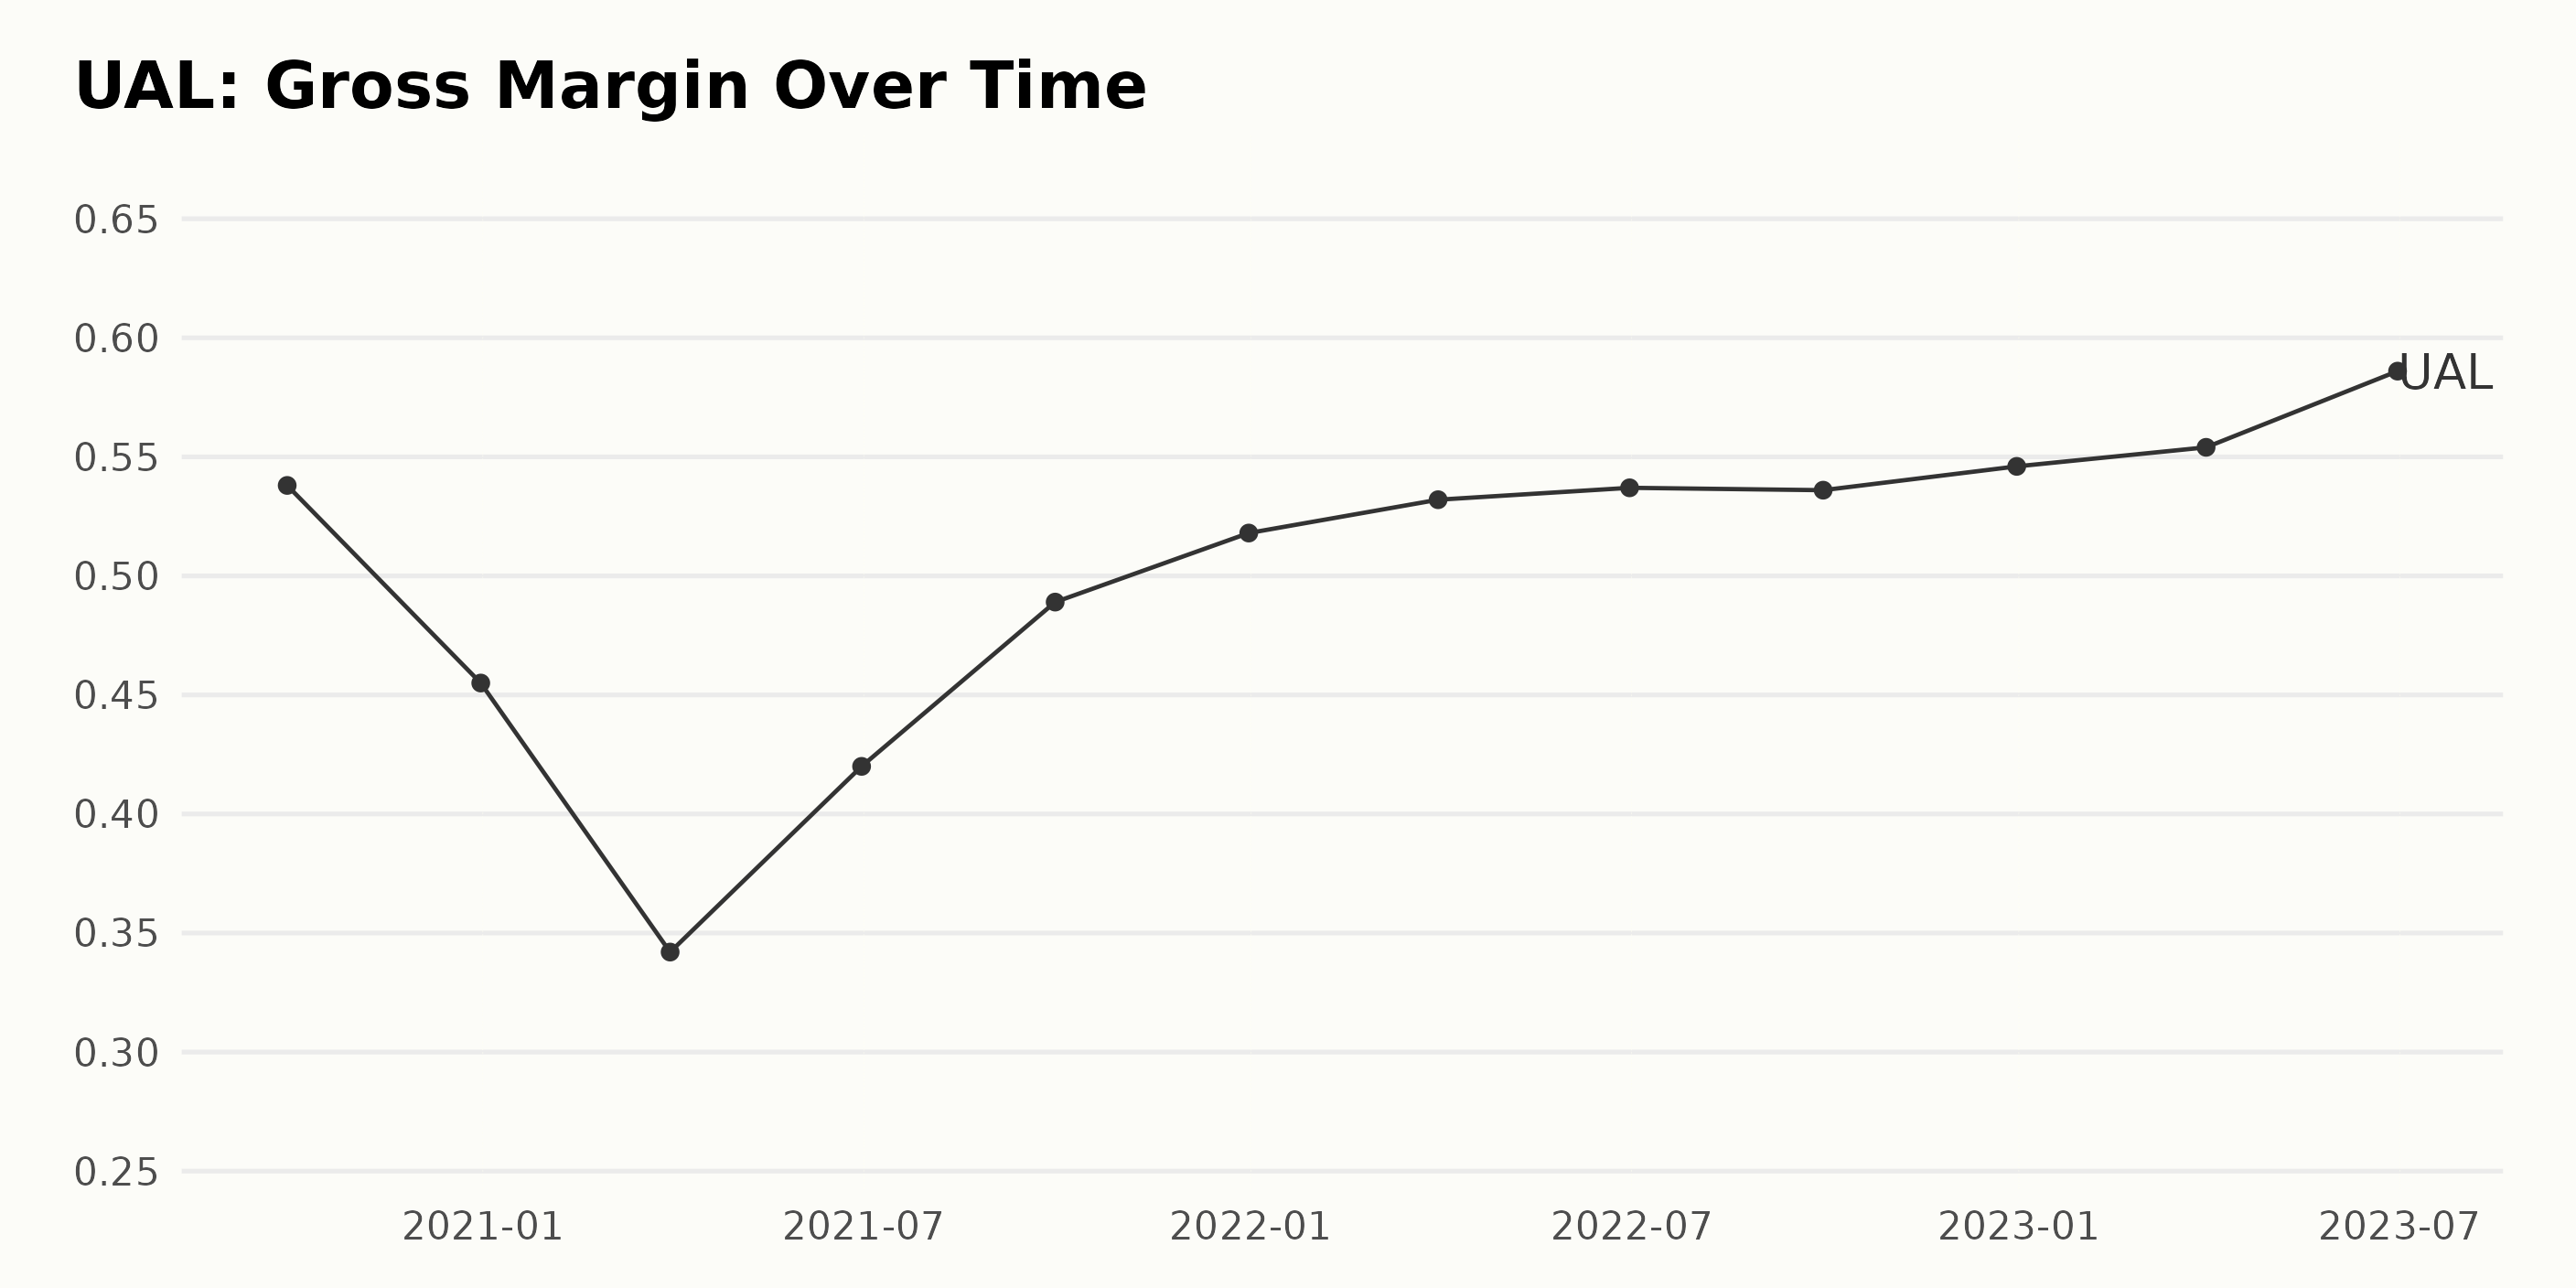
In the following list, I am examining changes in the gross margin of UAL starting from September 30, 2020, through to June 30, 2023:
- September 30, 2020: 53.8%
- December 31, 2020: 45.5%
- March 31, 2021: 34.2%
- June 30, 2021: 42.0%
- September 30, 2021: 48.9%
- December 31, 2021: 51.8%
- March 31, 2022: 53.2%
- June 30, 2022: 53.7%
- September 30, 2022: 53.6%
- December 31, 2022: 54.6%
- March 31, 2023: 55.4%
- June 30, 2023: 58.6%
From this data, we observe fluctuations in the gross margin of UAL. The company experienced a low point on March 31, 2021, with a gross margin of 34.2%. However, this was followed by a gradual and steady increase. The most recent data points warrant particular attention.
From December 2012 onwards, there has been consistent growth in the company's gross margin, reaching 58.6% by June 30, 2023 - an overall growth rate of roughly 4.8%. This indicates an uptrend in UAL’s financial performance over the noted period.
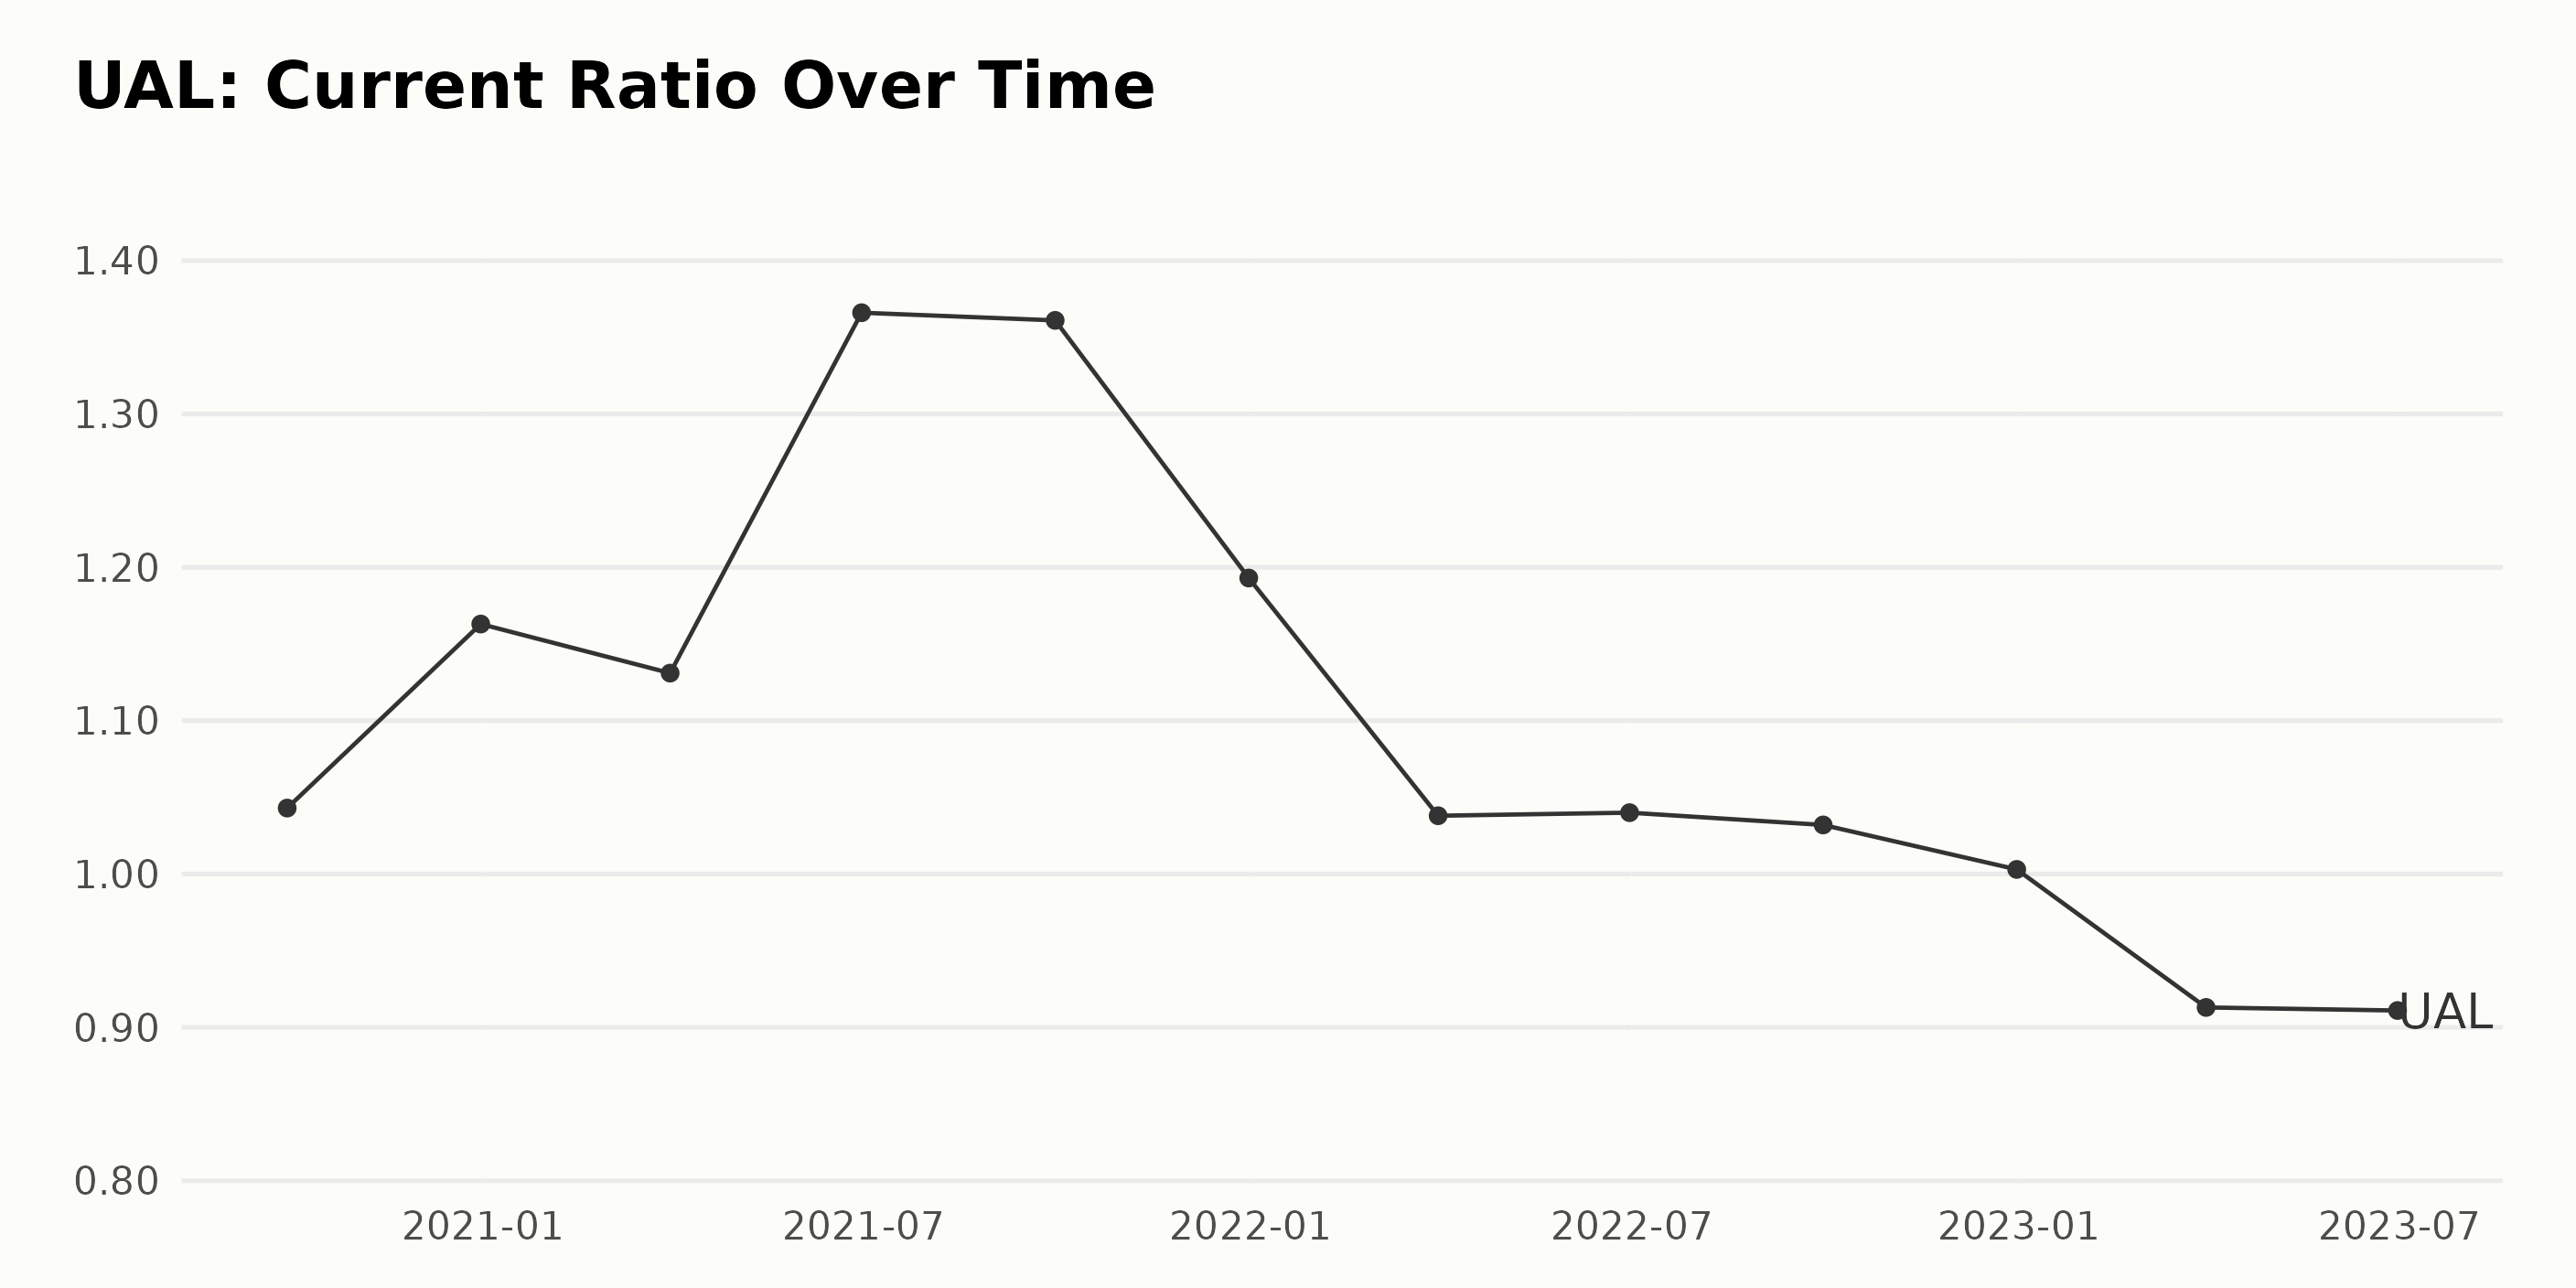
The current ratio of UAL has experienced both growth and decline periods over the years but exhibits a general downtrend in the more recent data:
- The ratio began at 1.04 on September 30, 2020, and experienced an increase, reaching a peak of 1.37 by June 30, 2021.
- However, this was followed by a consistent decline in the subsequent quarters, with the ratio dropping to 0.91 by June 30, 2023.
- Notably, the ratio witnessed a notable drop between December 31, 2022 (1.00), and March 31, 2023 (0.91).
This net decrease from the initial value indicates a negative growth rate. It is crucial to note that the last recorded value for the current ratio of UAL as of June 30, 2023, stands at 0.91, the lowest value in the series, indicating increasing financial risk.
Analyzing the Six-Month Trend and Volatility of United Continental Holdings Inc. Stock
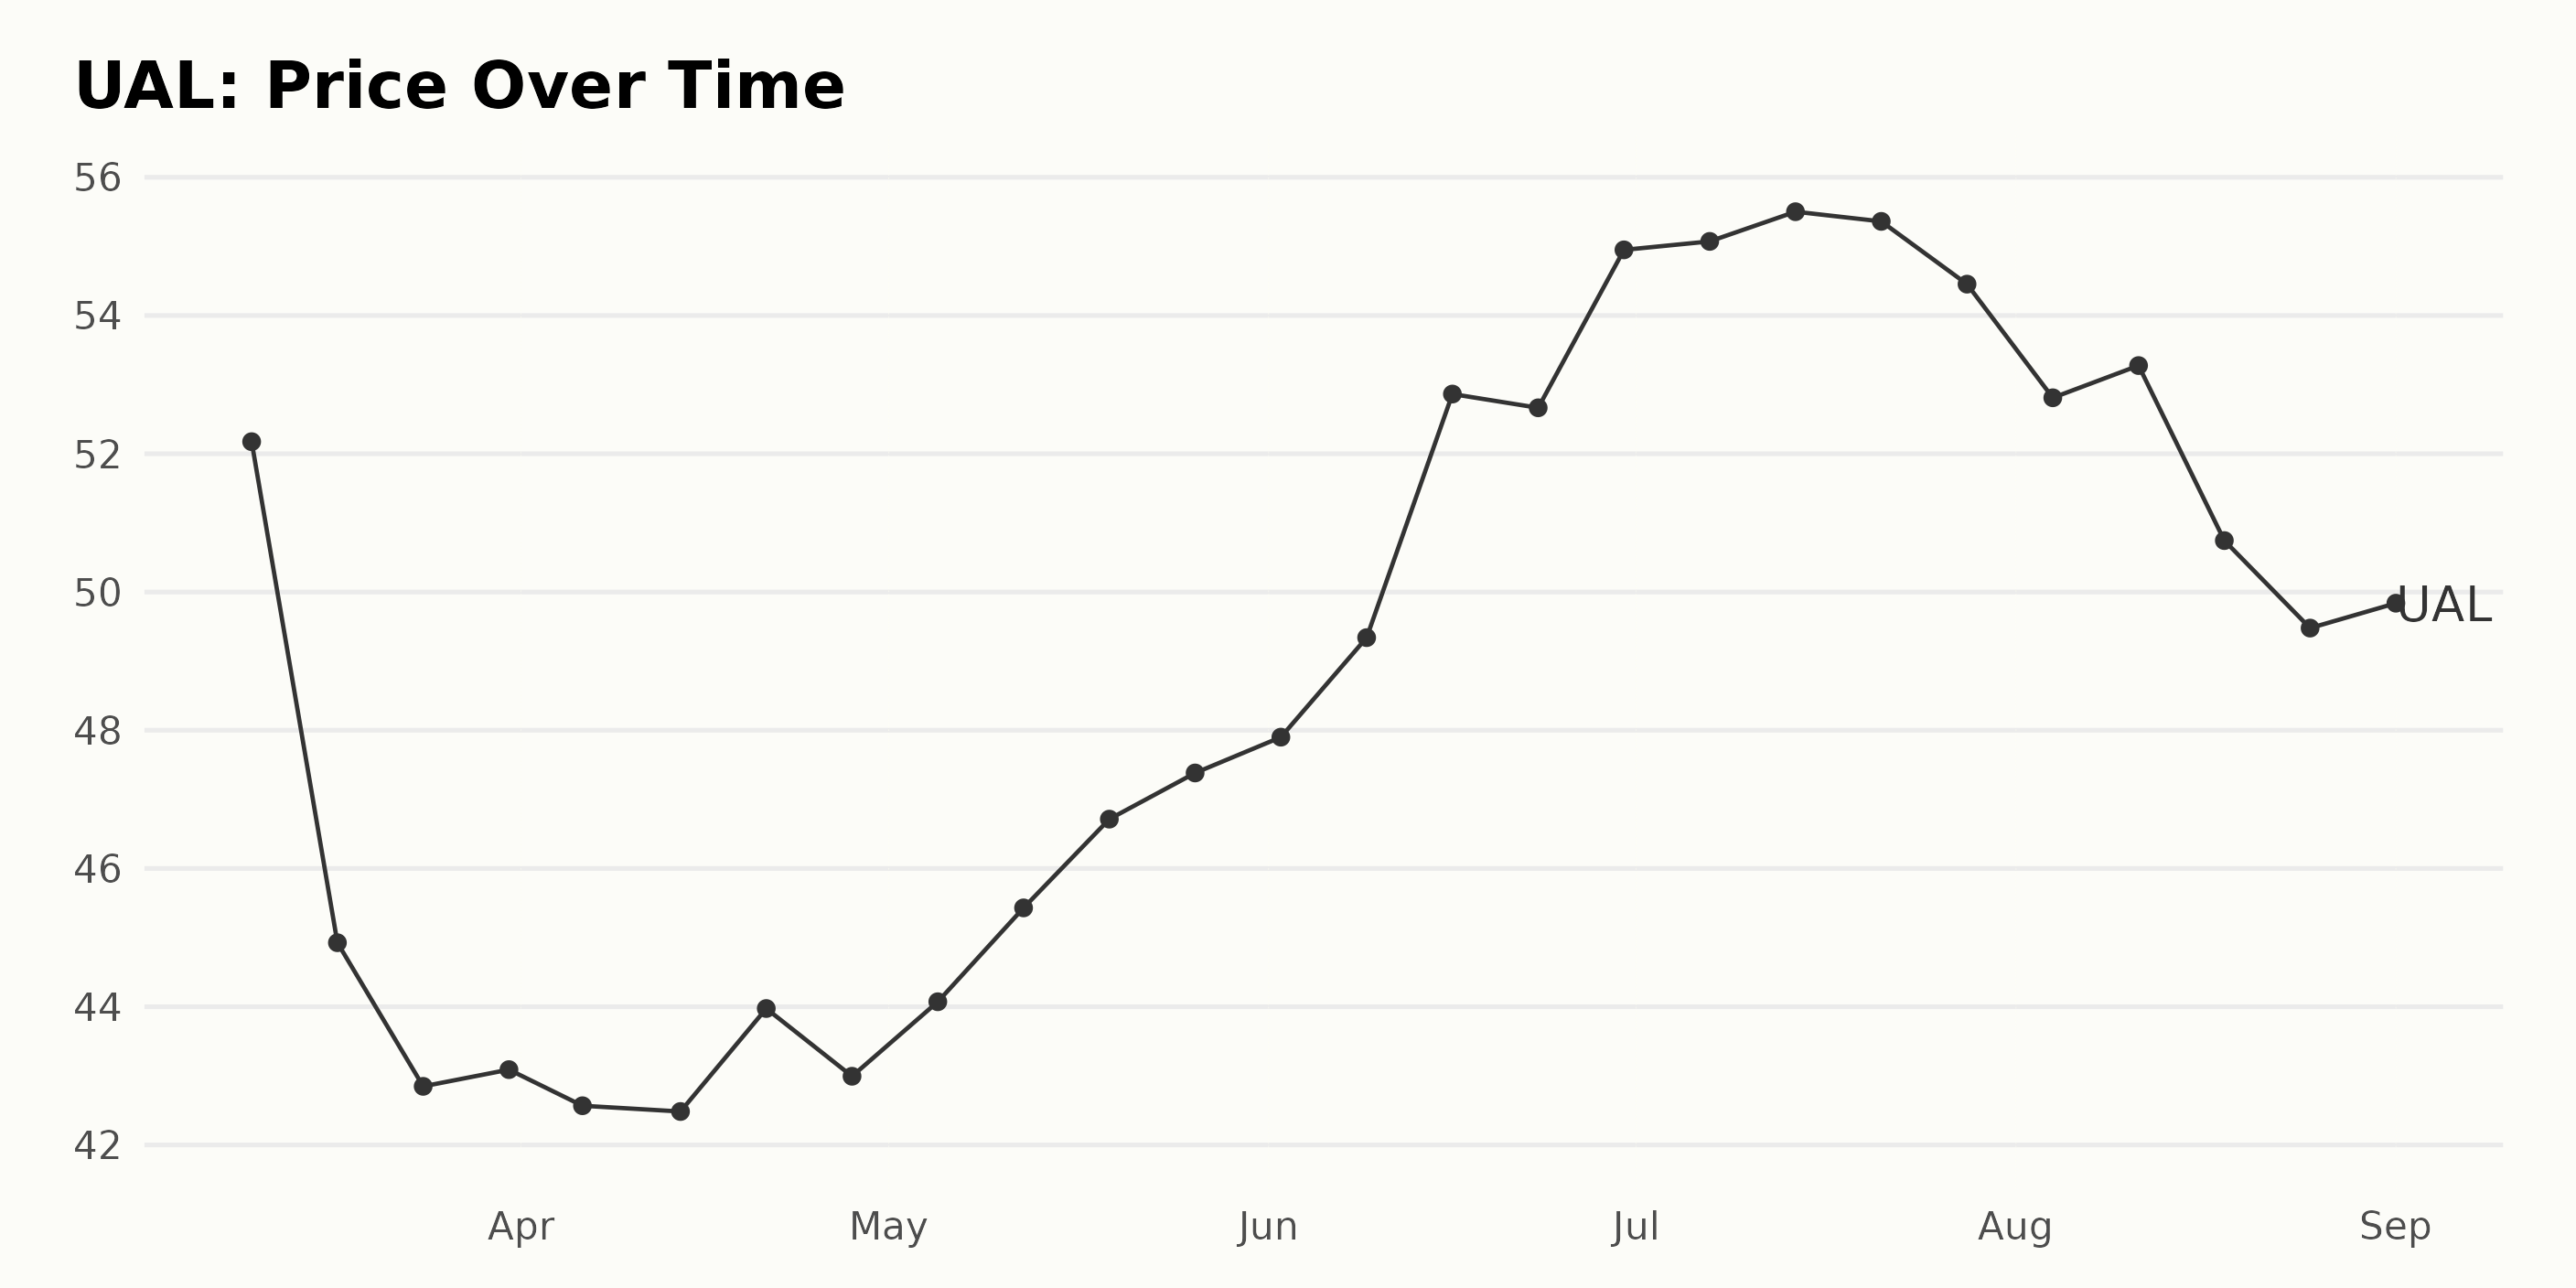
Looking at the provided data, we can summarize the trend and growth rate for UAL between March 2023 and September 2023.
- Starting on March 10, 2023, UAL's share price was $52.18.
- There was a consistent decrease through the remainder of March, bottoming on March 24 at $42.85.
- This downward trend slightly reversed at the end of March, where the price increased to $43.09 on March 31.
- Throughout April 2023, the price of the shares fluctuated around $42.48 and $43.97.
- From early May 2023, there was a clear upward trend, with a relatively steady increase in the price peaking at $55.50 on July 14, 2023.
- The share price then experienced little variation until the end of July, with a mild decline to $54.45 on July 28, 2023.
- In August 2023, there was a clear downward trend, with the price falling from $52.81 at the beginning of the month to $49.47 by the end of the month.
- In early September, the price slightly picked up to $48.47 on September 6, 2023.
There is a somewhat cyclical pattern here, with the share price initially decreasing, then increasing, before decreasing again. The rates of increase/decrease are moderate - there are no sudden or rapid changes within that period.
This could suggest stability in share price over time, or it could be due to seasonality or other underlying factors not immediately apparent from this data alone. Here is a chart of UAL's price over the past 180 days.
Analyzing UAL's Tri-Noteworthy POWR Ratings: Growth, Value, and Momentum (March-September 2023)
UAL, which falls under the Airlines category of stocks, has seen some variation in its POWR Ratings grade and rank within the category over recent months. The latest data available as of September 6, 2023, reveals that the POWR grade for UAL is currently a C (Neutral).
This represents a slight decline from the preceding weeks, which saw UAL maintaining a B (Buy) grade. The rank in category stands at position #15, which places it just above mid-range, considering that the Airlines category comprises 27 stocks. Below is an overview of the changes experienced within the reporting period:
- The POWR grade was consistently at C (Neutral) from March 11, 2023, to June 24, 2023.
- A noticeable improvement took place in the week of July 1, 2023, with the POWR grade moving up to B (Buy). This continued through to August 26, 2023.
- Unfortunately, a downshift occurred during the week of September 6, 2023, with the POWR grade returning to C (Neutral).
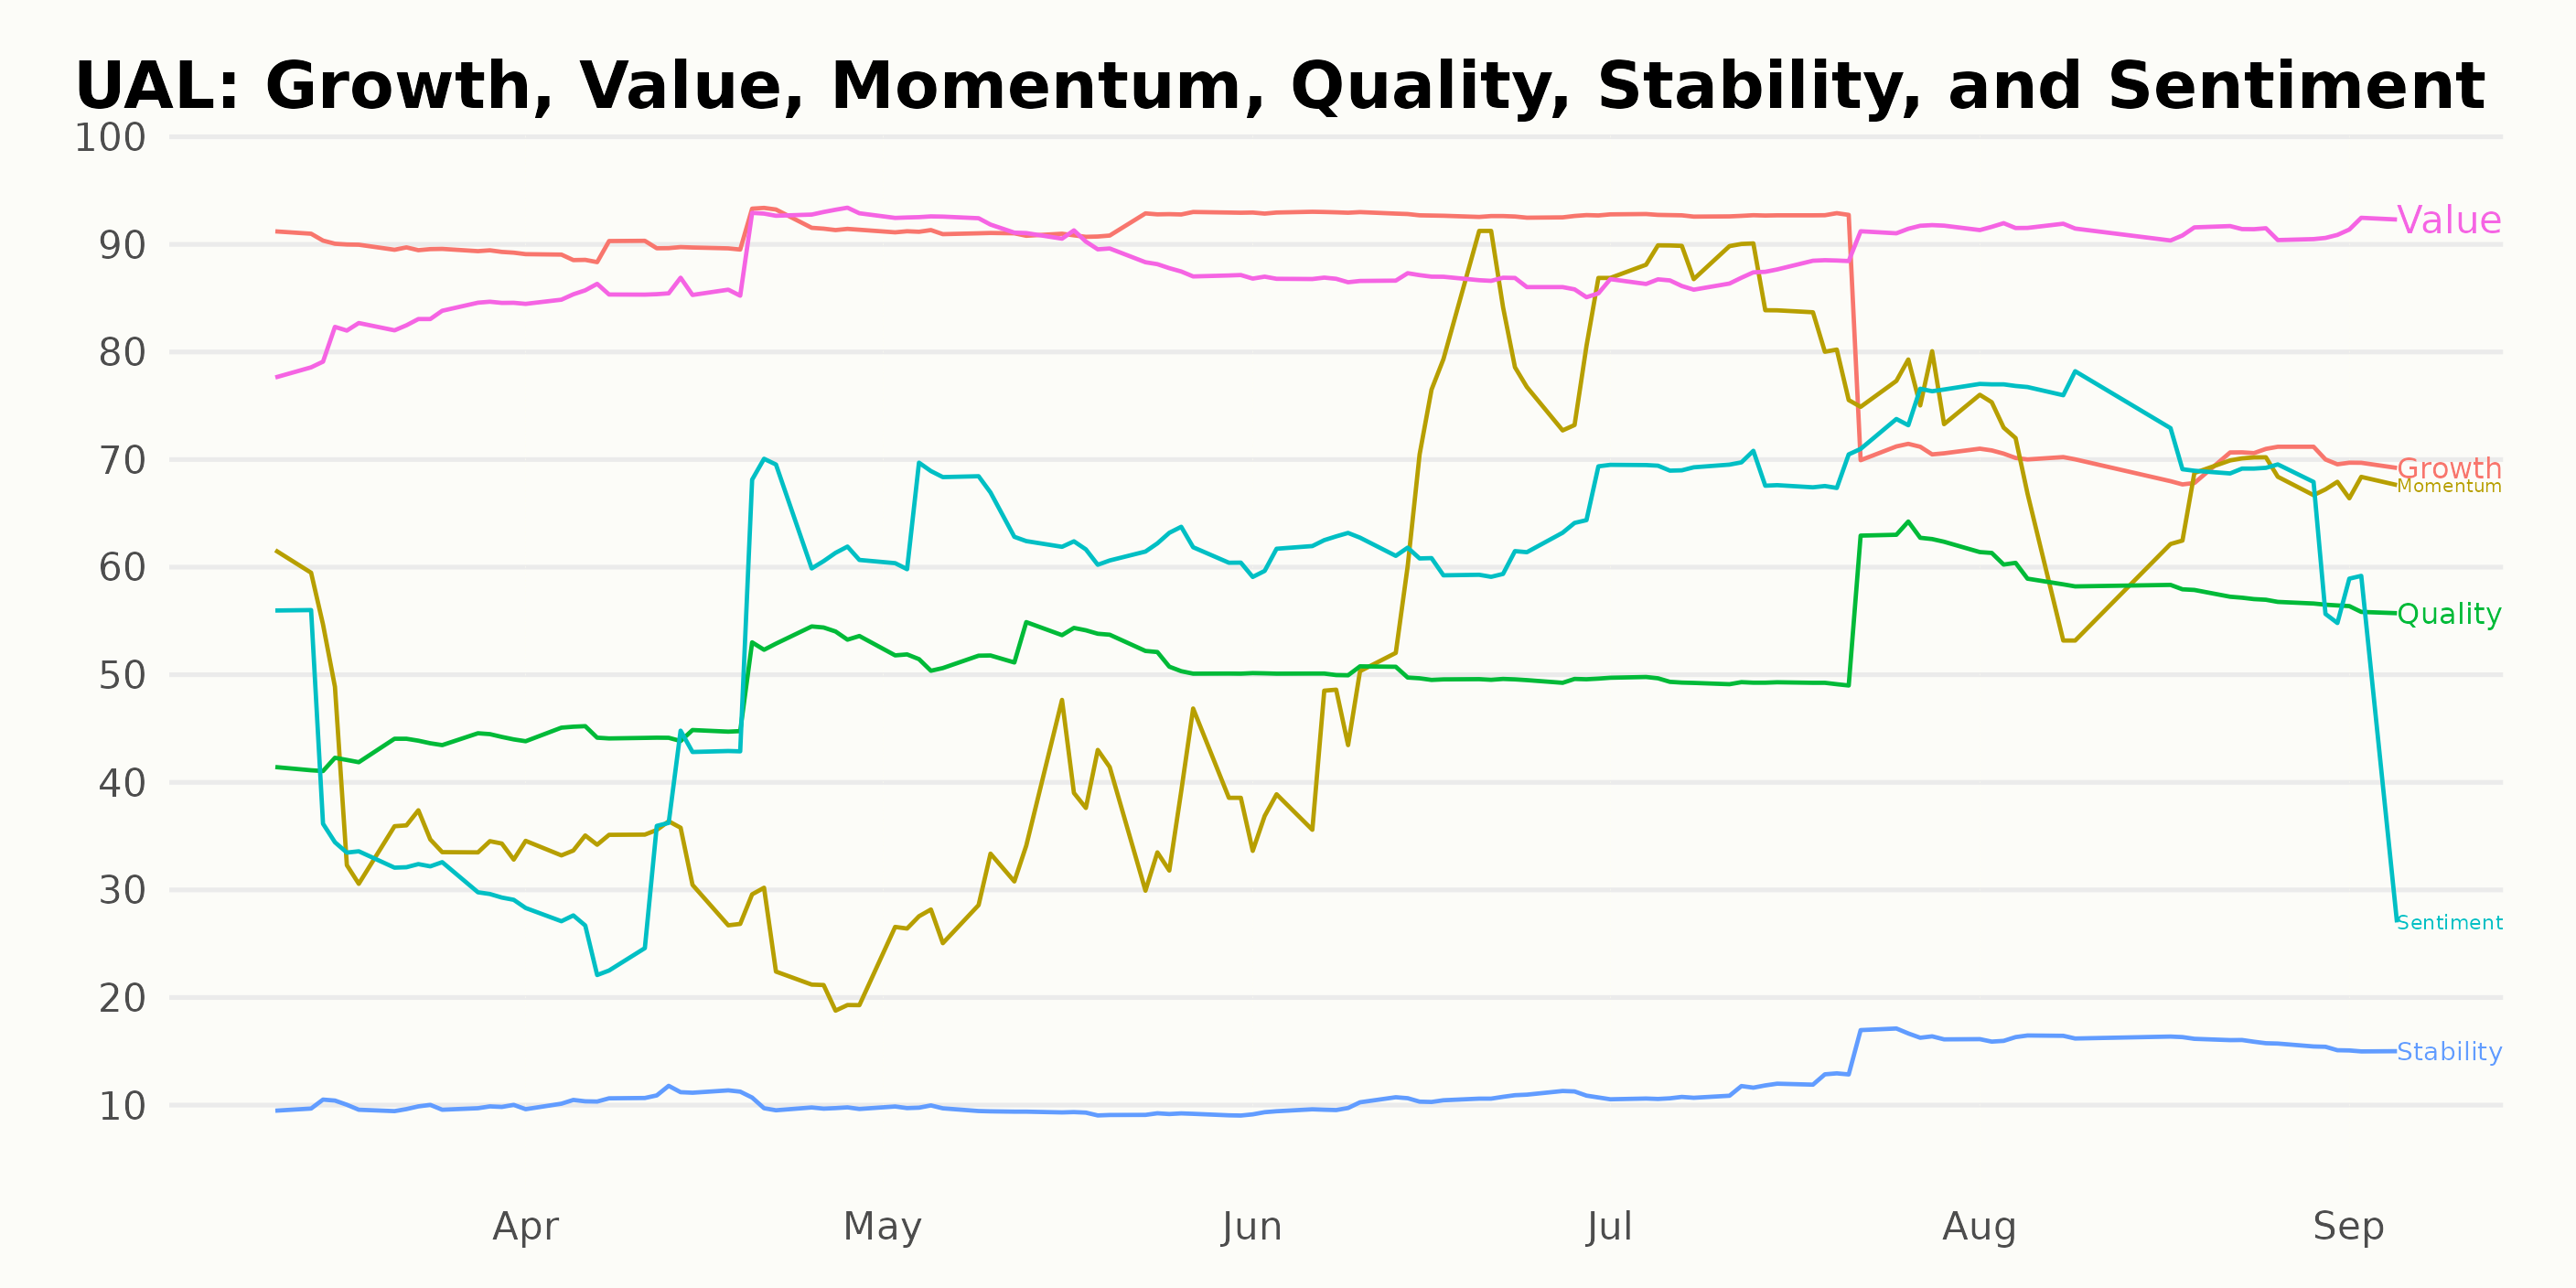
Upon analyzing the POWR Ratings for UAL, the three most noteworthy dimensions, measured from March to September 2023, are Growth, Value, and Momentum.
Growth: In March 2023, UAL had a strong growth score of 90, making it one of the highest-rated dimensions. This score remained constant in April despite volatility in other metrics. By May, there was a slight increase to 92, which further rose to 93 in June. In July, it declined to 86, after which a significant decrease to 70 happened in August, which carried on into September.
Value: The value dimension started at 82 in March 2023, but by April, UAL had an increased value score of 88. Continued progression was observed in the subsequent months, with the score rising to its peak of 92 in September.
Momentum: Momentum for UAL was varied throughout the assessed period. It started at 40 in March 2023 and showed a gradual decline in April (29) and a slight increase in May (35). A clear upward trend can be seen from June (64), reaching its highest at 83 in July. This ascension was followed by a small dip in August and September, recording 67 in both months.
How does United Continental Holdings, Inc. (UAL) Stack Up Against its Peers?
Other stocks in the Airlines sector that may be worth considering are Cathay Pacific Airways Limited (CPCAY), Air France-KLM SA (AFLYY), and Air Canada (ACDVF) - they have better POWR Ratings. To explore more Airlines stocks, click here.
What To Do Next?
Discover 10 widely held stocks that our proprietary model shows have tremendous downside potential. Please make sure none of these “death trap” stocks are lurking in your portfolio:
UAL shares were trading at $48.74 per share on Wednesday afternoon, up $0.27 (+0.56%). Year-to-date, UAL has gained 29.28%, versus a 17.35% rise in the benchmark S&P 500 index during the same period.
About the Author: Anushka Dutta

Anushka is an analyst whose interest in understanding the impact of broader economic changes on financial markets motivated her to pursue a career in investment research.
The post Is United Airlines (UAL) a Buy After Labor Day? appeared first on StockNews.com