
Live TV streaming platform operator fuboTV Inc. (FUBO) allows customers to access content through streaming devices. Recently, the company raised its 2023 revenue guidance for North America. FUBO expects revenue of $1.26 billion to $1.28 billion, representing 29% year-over-year growth at the midpoint. However, it is yet to achieve positive cash flow.
The company’s topline growth has been impressive over the years. Over the past three years, its revenue grew at a 176.8% CAGR. On the other hand, its profitability is still in the red. Its trailing-12-month net income margin of negative 37.09% compares to the industry average of 3.60%.
The stock closed its last trading session at $2.33, lower than the 50-day and 10-day moving averages of $2.42 and $2.69, respectively.
Given this backdrop, let’s look at the trends of FUBO’s key financial metrics to understand why it could be wise to avoid the stock now.
Analyzing FUBO's Financial Performance and Analyst Predictions from 2020-2023
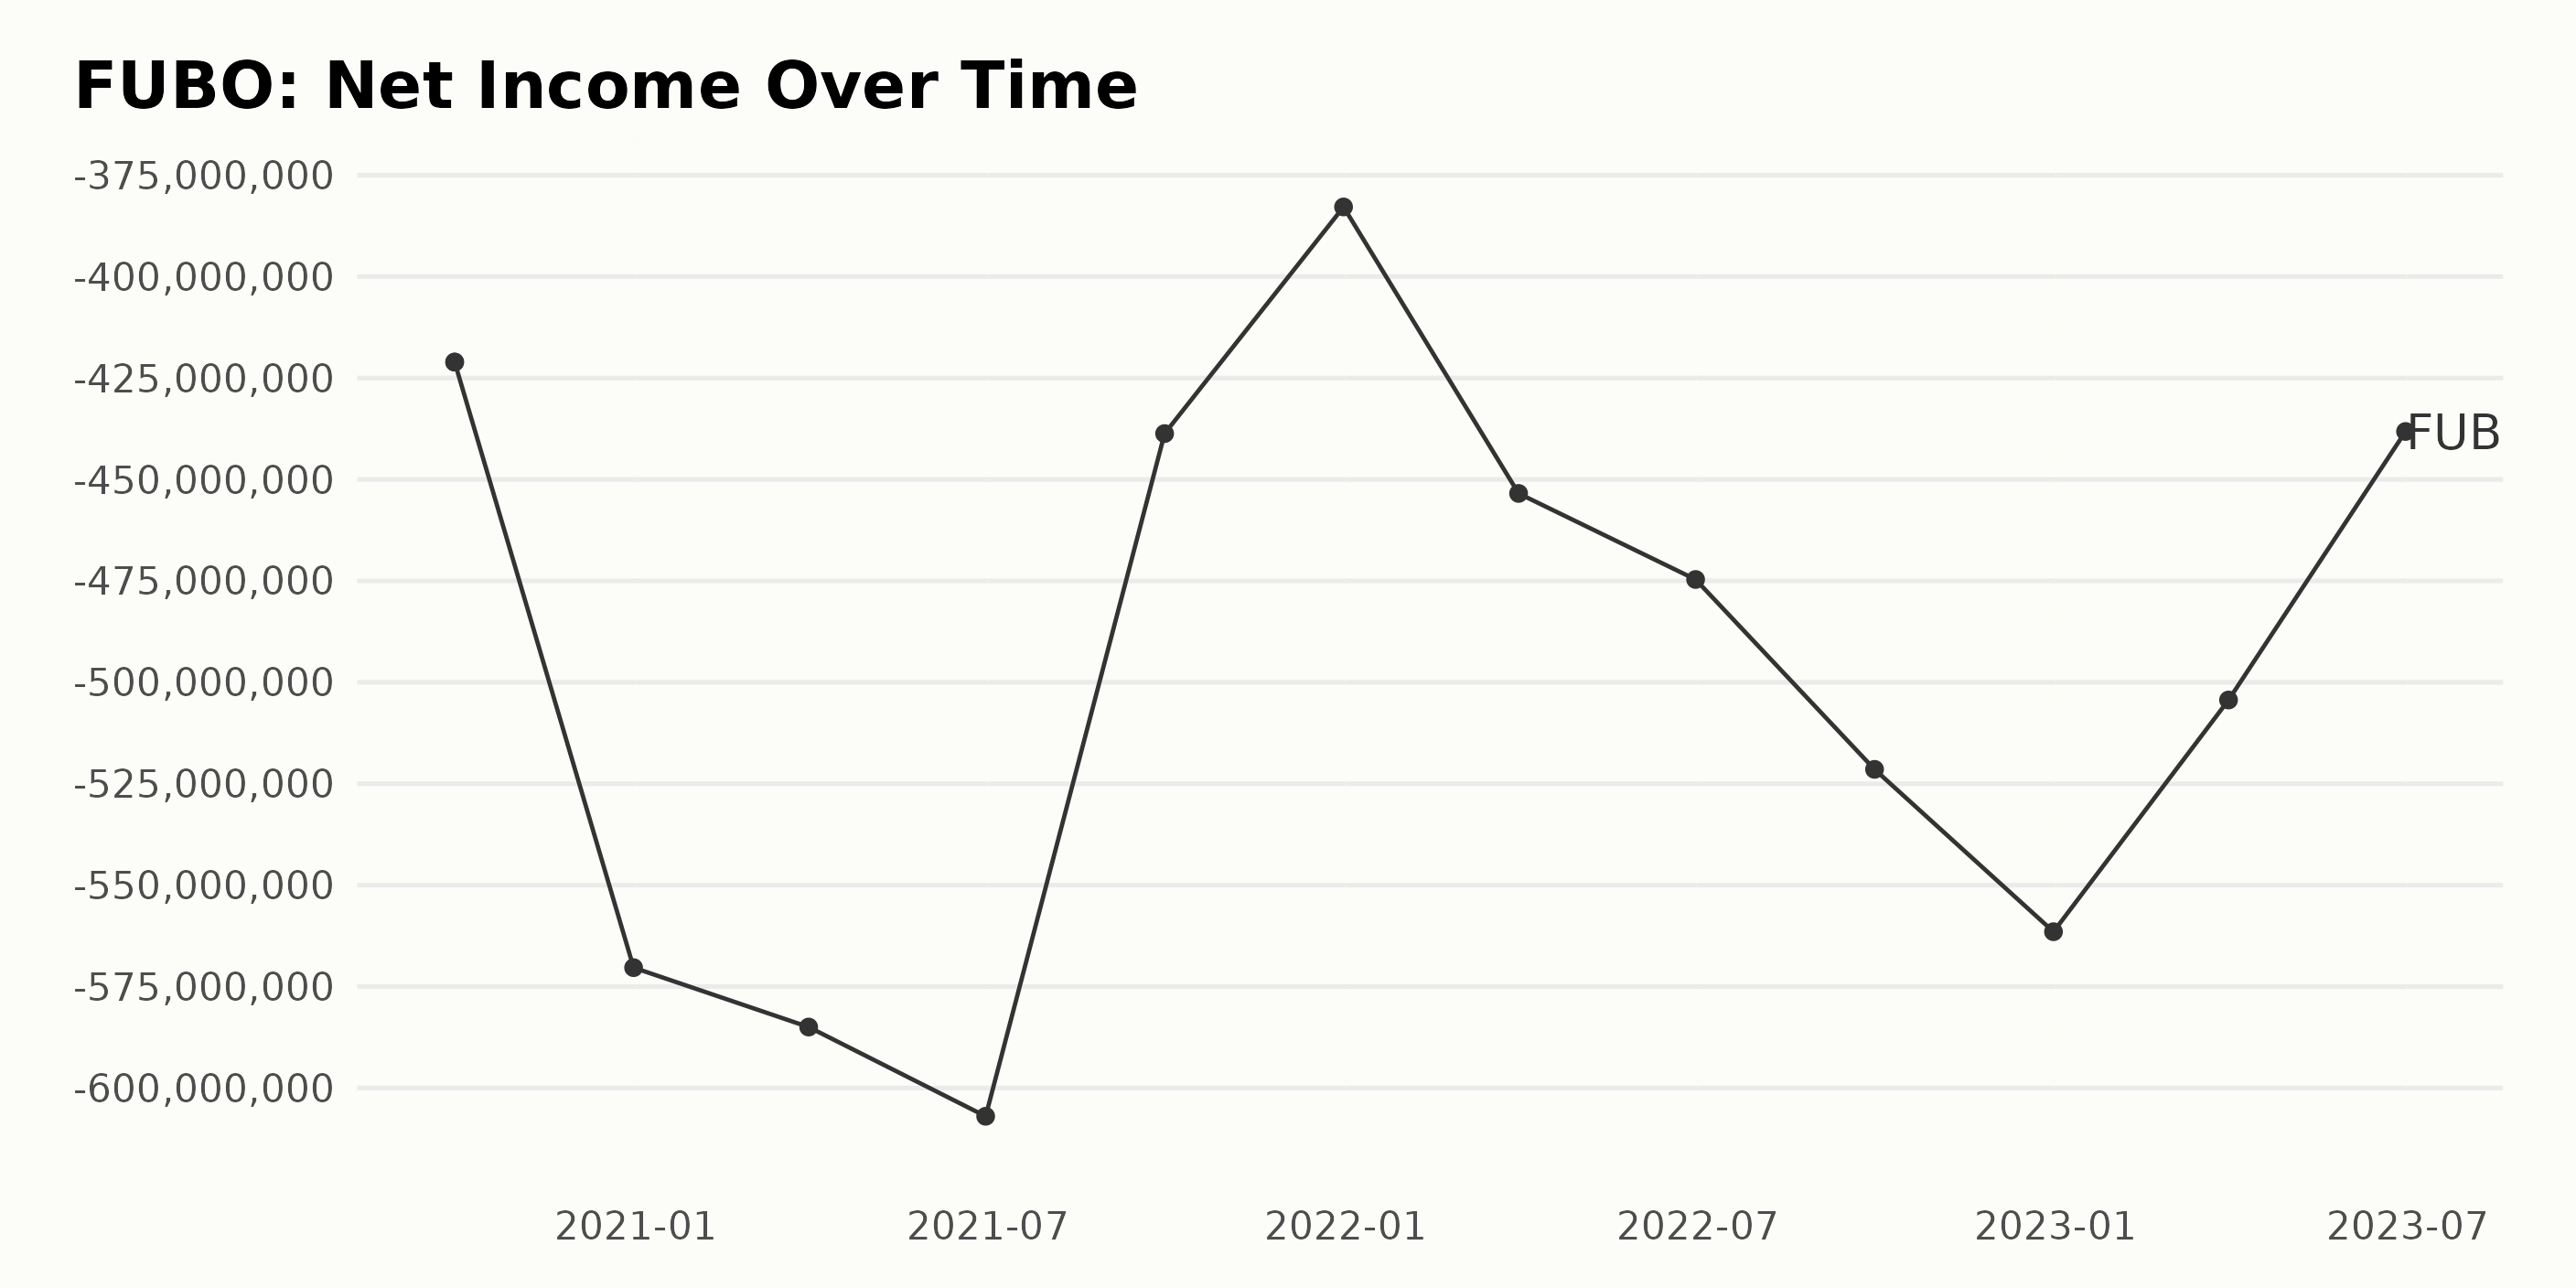
The trailing-12-month net income trend for FUBO shows a general upward fluctuation from September 2020 to December 2022, followed by a slight downward curve noted in the recent quarters of 2023. Here is the breakdown:
- Initially, from September 2020 to December 2020, net income reported a negative increase from -$421.08 million to -$570.33 million.
- Subsequently, there was a consistent rise in losses until June 2021, with the net income soaring to -$606.97 million.
- A short reprieve occurred from June 2021 to December 2021 as the losses reduced considerably to -$382.84 million.
- However, from then onwards into 2022, the losses once more escalated, reaching a peak of -$561.48 million by December.
- From the start of 2023, the net income witnessed a downward trend, reducing the losses to -$438.18 million as of June 2023.
Concerning the growth rate calculated from the first value to the last, there was an increase of about 4% in losses. Given these constant fluctuations, the latter emphasis of data shows a declining trend in FUBO's net income.
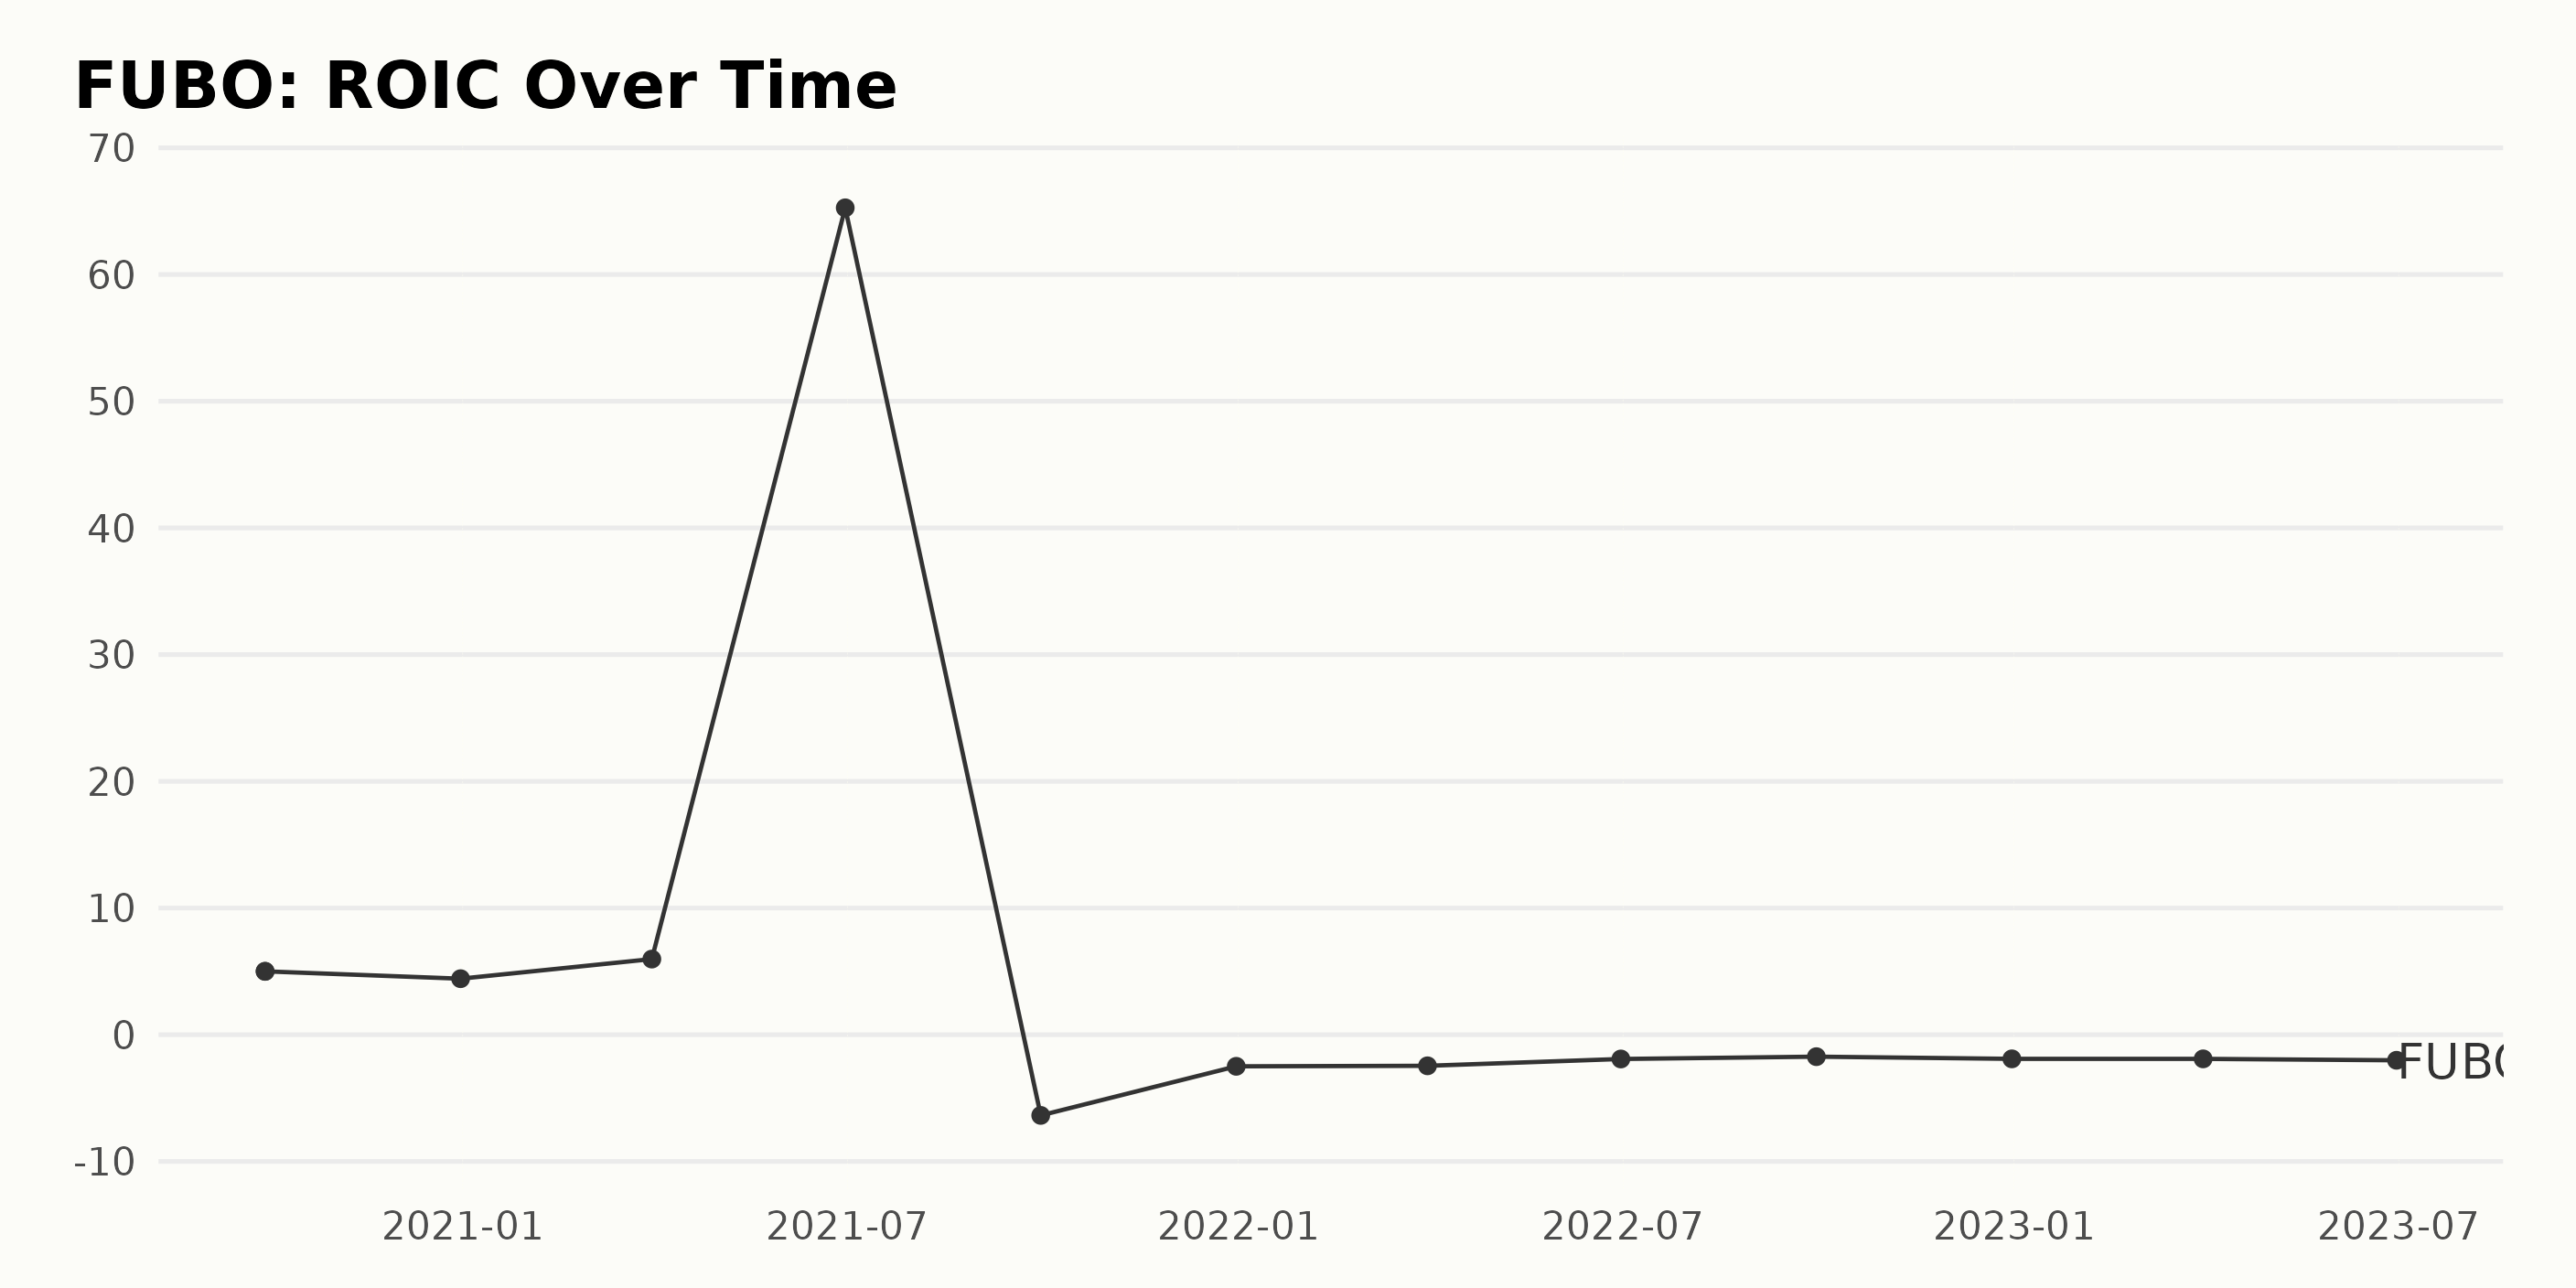
The following summary describes the trend and fluctuations of reported Return on Invested Capital (ROIC) for FUBO.
- ROIC started at 5.00% in the third quarter of 2020.
- By the fourth quarter of 2020, ROIC had dropped to 4.42% before climbing again to 5.97% in the first quarter of 2021.
- In the second quarter of 2021, there was an unusually sharp increase, with ROIC reaching a peak of 65.26%.
- However, in the third quarter of 2021, there was a dramatic drop, leading to negative ROIC values. The reported ROIC for the third quarter of 2021 was -6.37%, which further deteriorated to -2.49% in the fourth quarter.
- In 2022, FUBO continued to exhibit negative ROIC, though the values progressively became less severe. The ROIC values for the first, second, third, and fourth quarters of 2022 were -2.45%, -1.91%, -1.73%, and -1.90%, respectively.
- In the first quarter of 2023, the ROIC remained relatively stable at -1.91% but worsened slightly in the second quarter to -2.02%.
In general, the data shows a decreasing trend. From the first value in the third quarter of 2020 (5.00%) to the last recorded value in the second quarter of 2023 (-2.02%), FUBO's ROIC has decreased by approximately 140%.
The drastic negative shift in ROIC from the second quarter of 2021 highlights a serious period of diminishing returns on invested capital, despite some signs of a slowing rate of decline from the third quarter of 2021 onward.
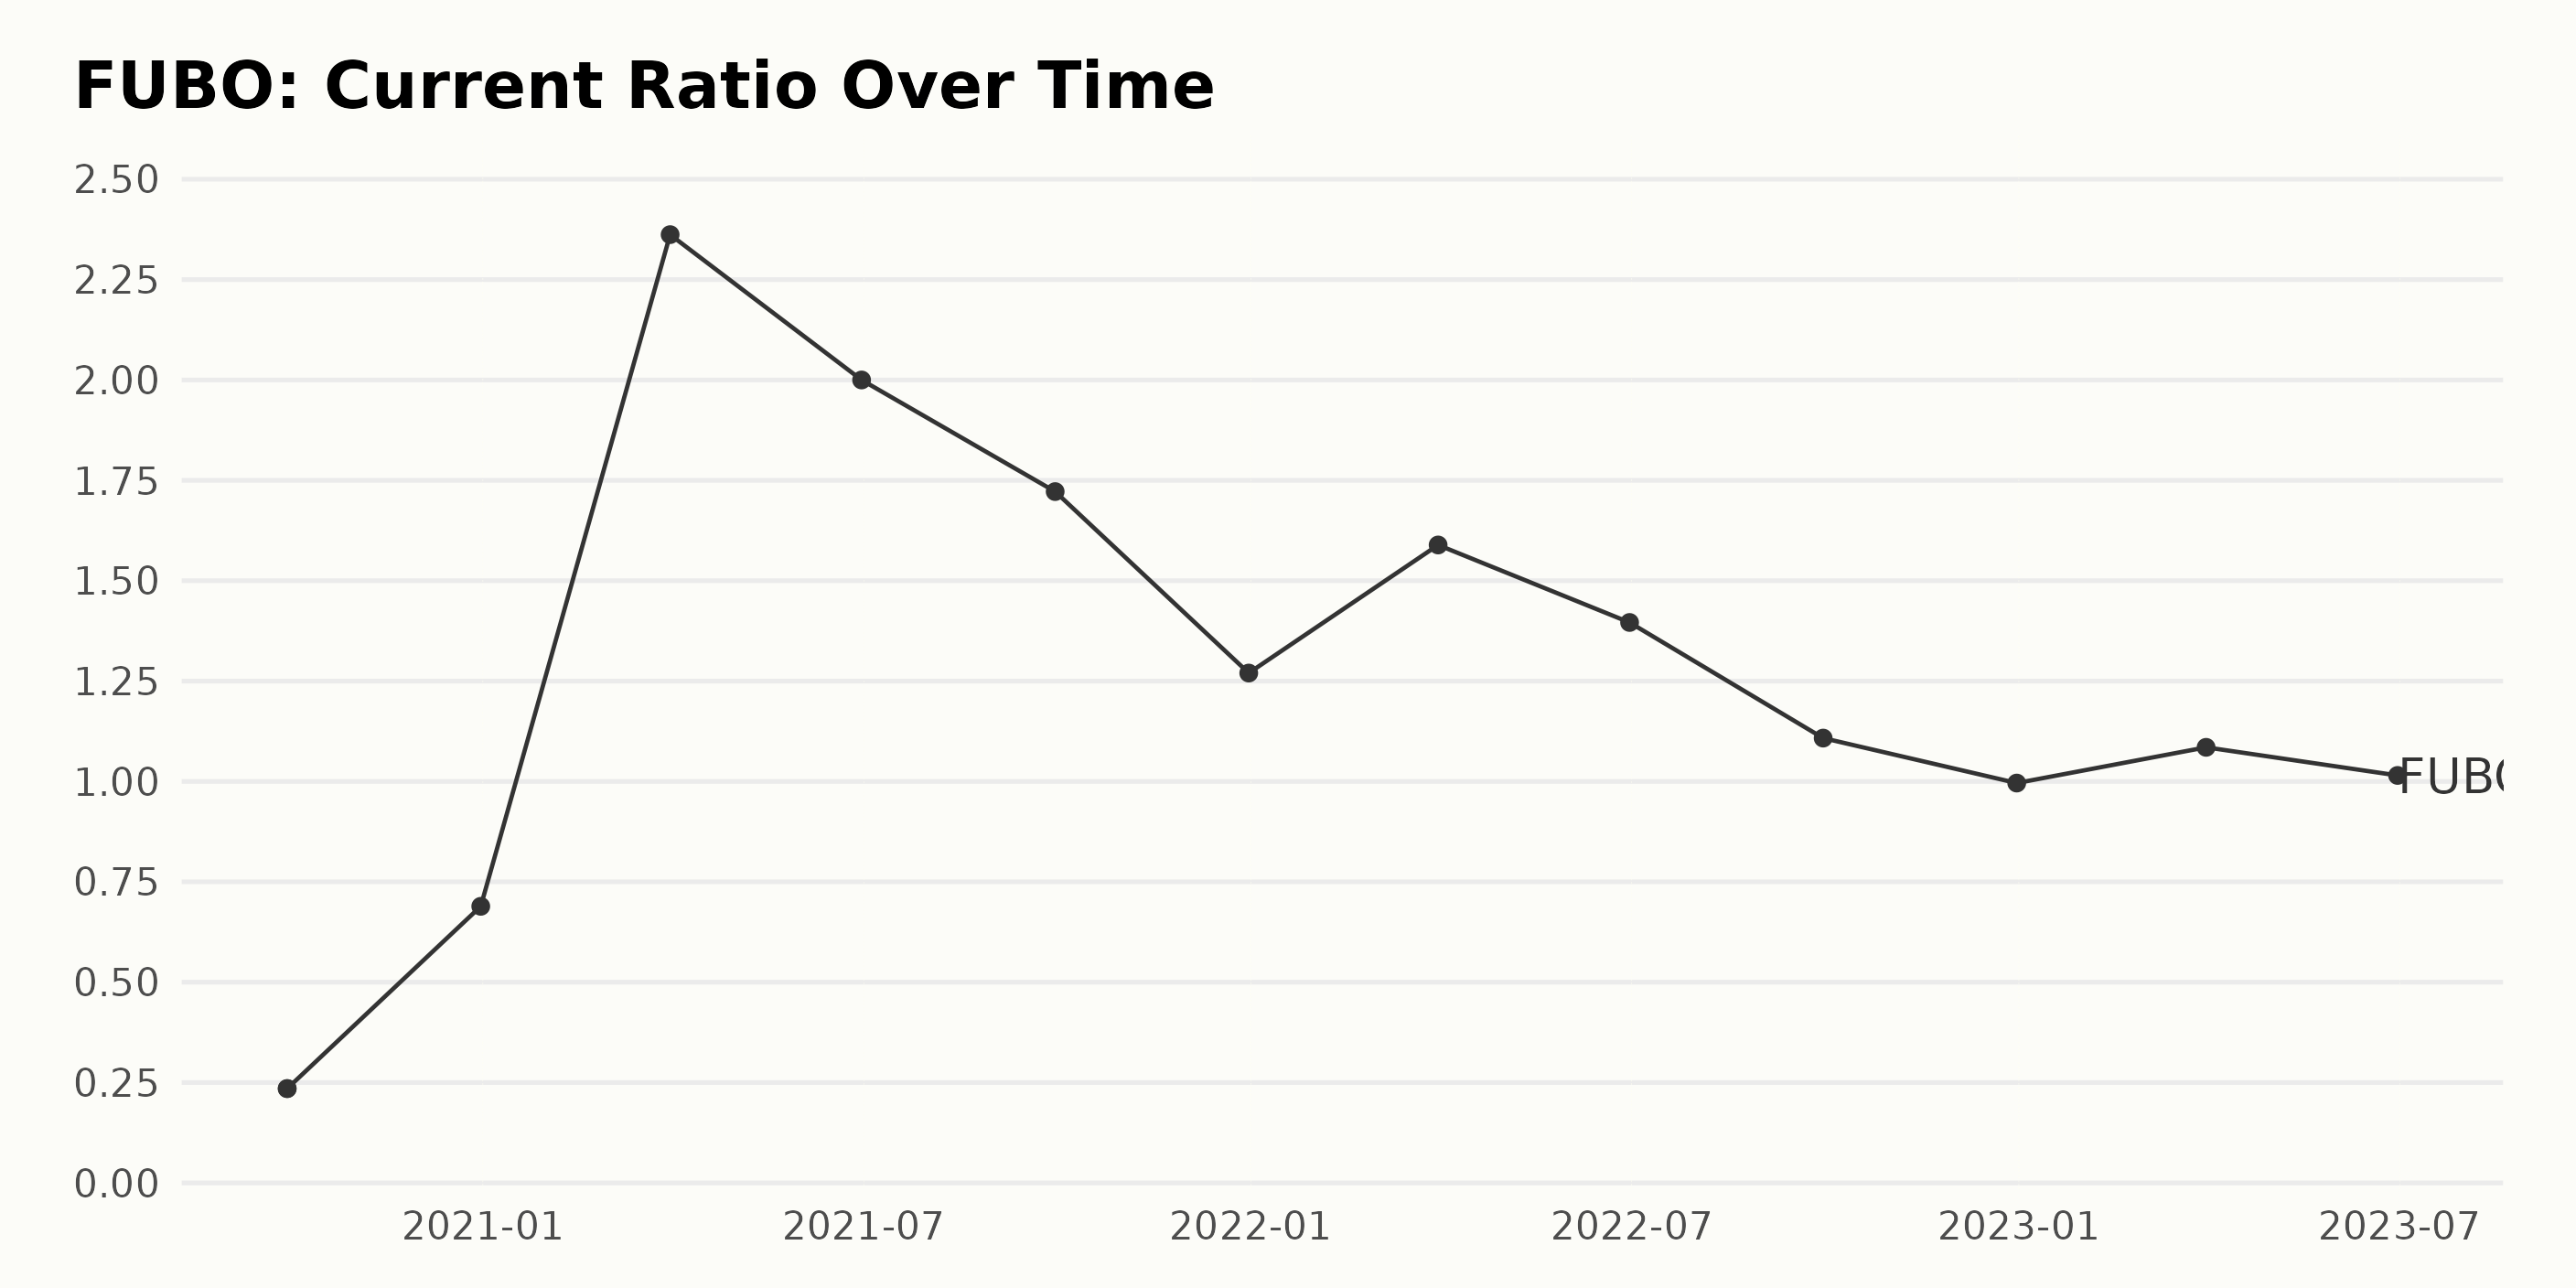
The current ratio of FUBO experienced a generally rising trend from September 2020 to March 2021, followed by a fluctuating declining trend from that point onwards until June 2023. Here is a more detailed breakdown:
- On September 30, 2020, the current ratio was 0.24.
- This ratio saw a significant increase to 0.69 by December 31, 2020.
- A rapid growth continued, reaching its peak of 2.36 on March 31, 2021.
- Between April 2021 and September 2021, it declined slightly to 1.72 while maintaining above 1.
- However, by the end of 2021, the value had further reduced to 1.27.
- The downward trend carried over into 2022, with the current ratio decreasing monthly from 1.59 in the first quarter (March 31, 2022) to 0.99 at year-end (December 31, 2022).
- During 2023, the current ratio started rebounding slightly, rising to 1.08 in the first quarter (March 31, 2023) and settling around 1.01 by the end of the second quarter (June 30, 2023).
By measuring the last value from the first, the overall growth rate from September 30, 2020, to June 30, 2023, is approximately 331%. Despite fluctuating figures, the major key point in this data series is that FUBO's current ratio, with minor exceptions, maintained above 1, suggesting that it possesses more current assets than current liabilities in most periods.
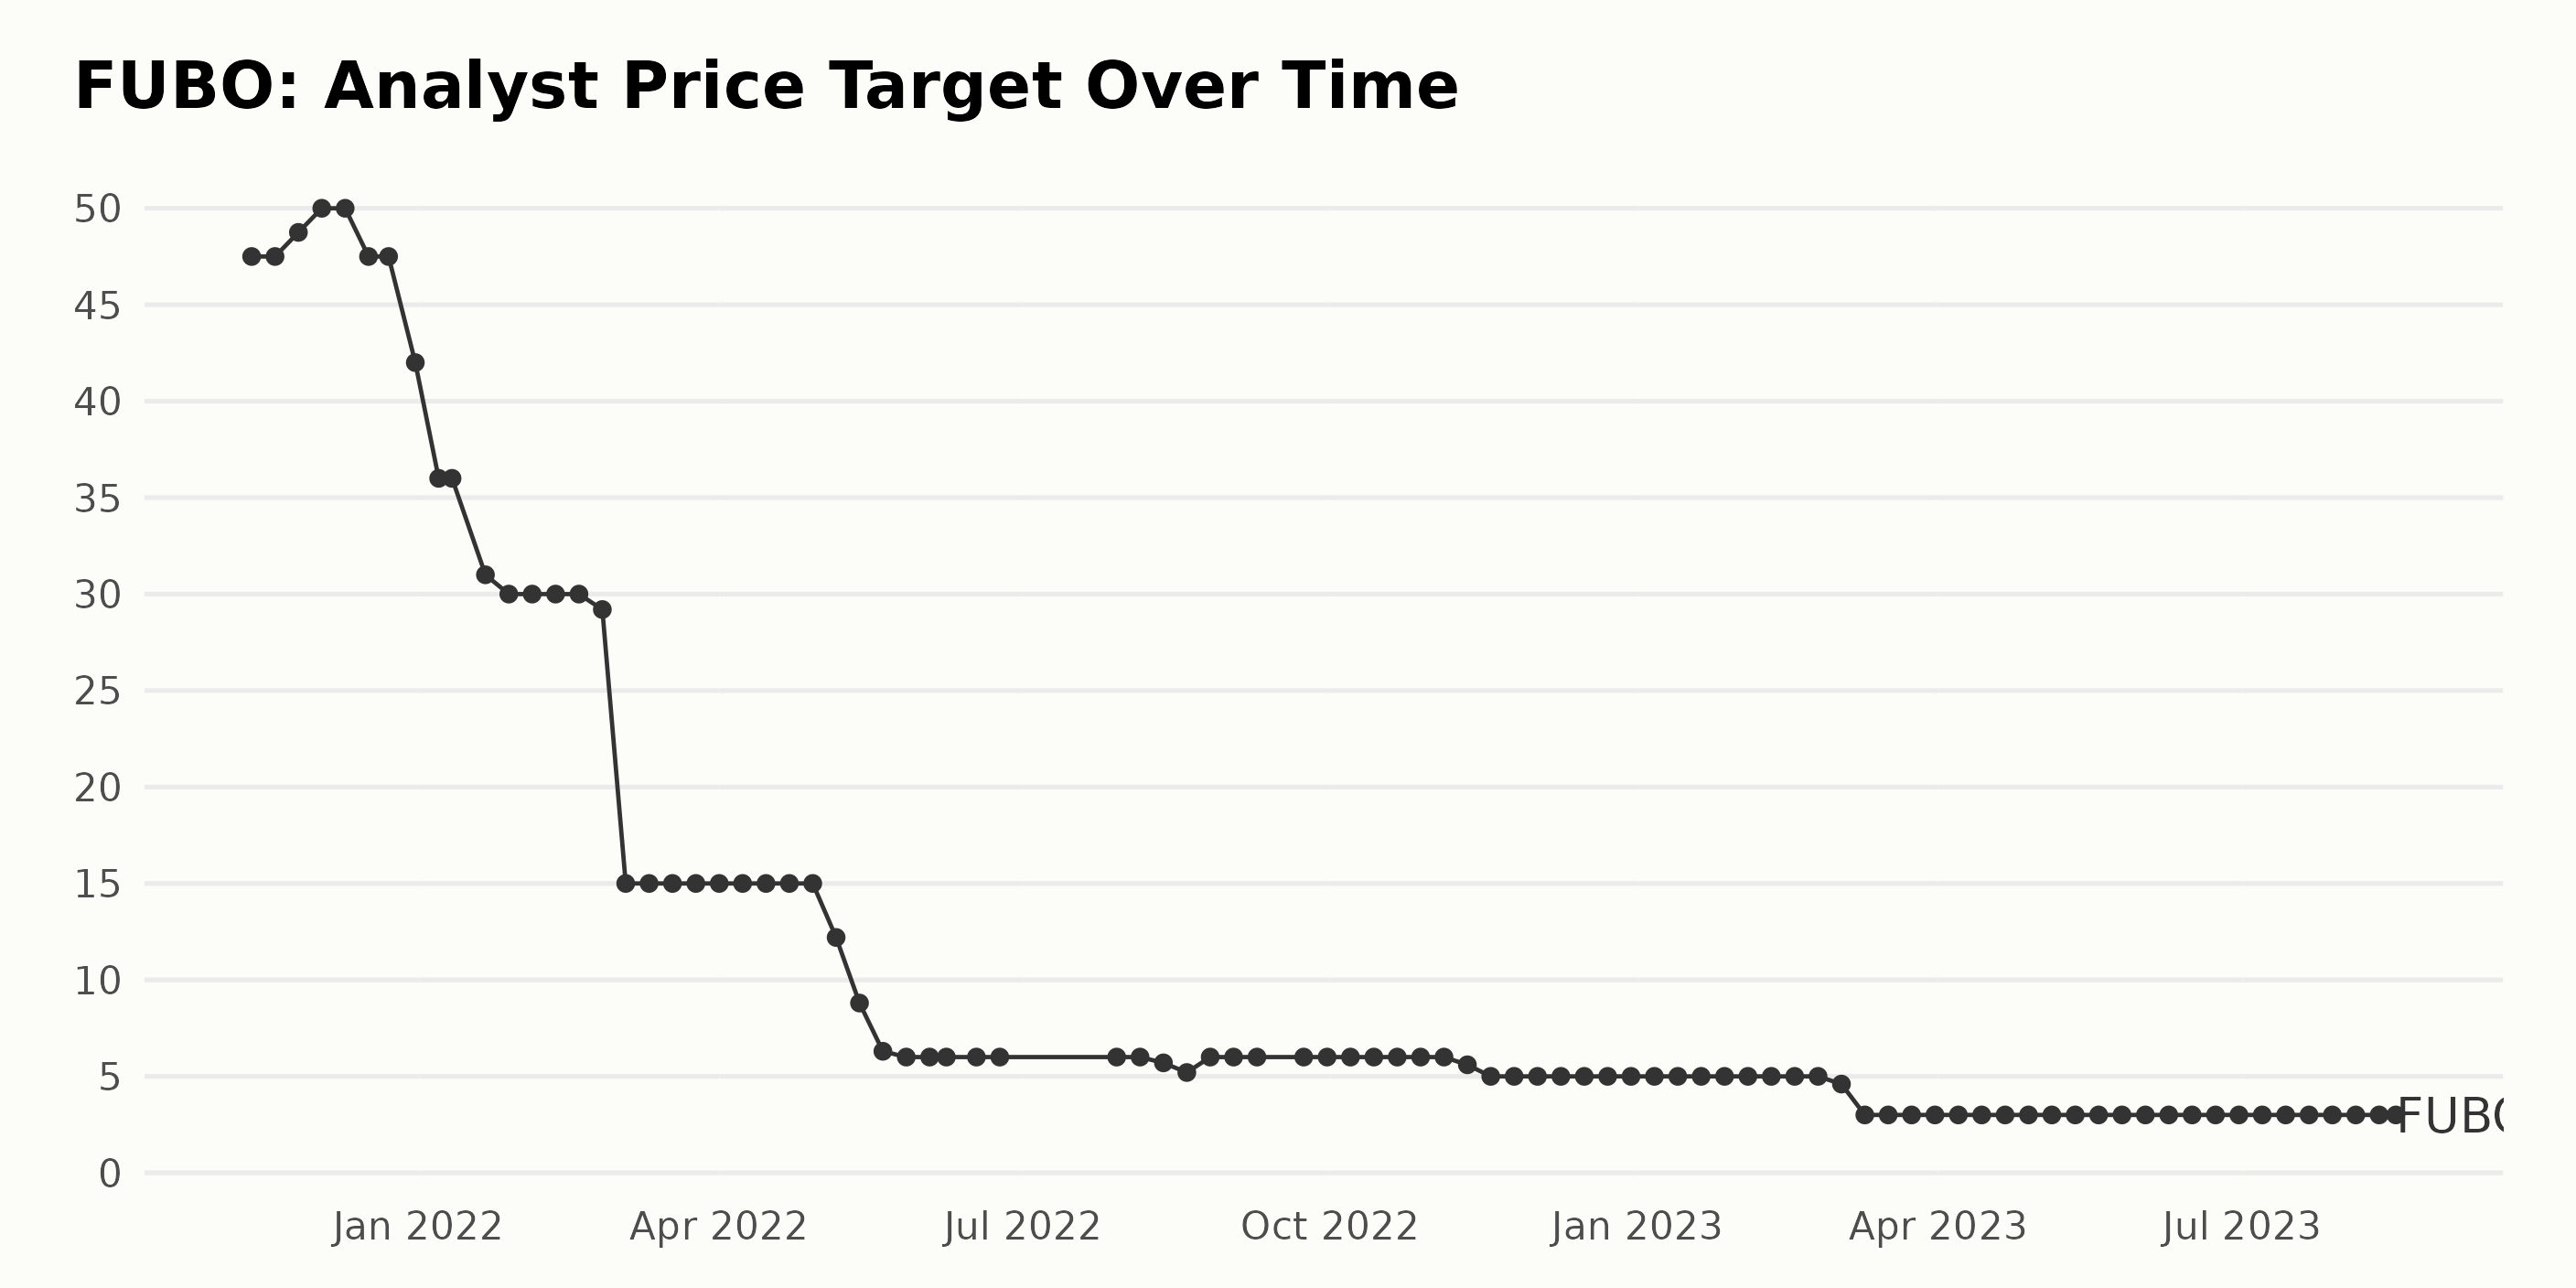
The analyst price target for FUBO has seen significant fluctuations and a consistent downward trend over the observed time period. Below are some key points:
- The first reported value was in November 2021, with an analyst price target of $47.50.
- The price target briefly increased to a peak of $50 in December 2021.
- However, from the start of 2022 onwards, the value began to decrease steadily, reaching $30 by February.
- This decline continued throughout the first half of the year, reaching as low as $5.60 by November 2022.
- Despite slight regrowth to $6 in August 2022, the analyst price target continued its downtrend, sitting at a much-reduced value of $3 from March to August 2023.
The overall trend of the analyst price target for FUBO has been decidedly negative, decreasing by approximately 93.68% from the initial value of $47.50 to the final value of $3 as of August 2023. This represents a major decrease in analyst confidence in FUBO over this timeframe.
Analyzing FUBO's Stock Performance: A Journey of Volatility and Growth in 2023
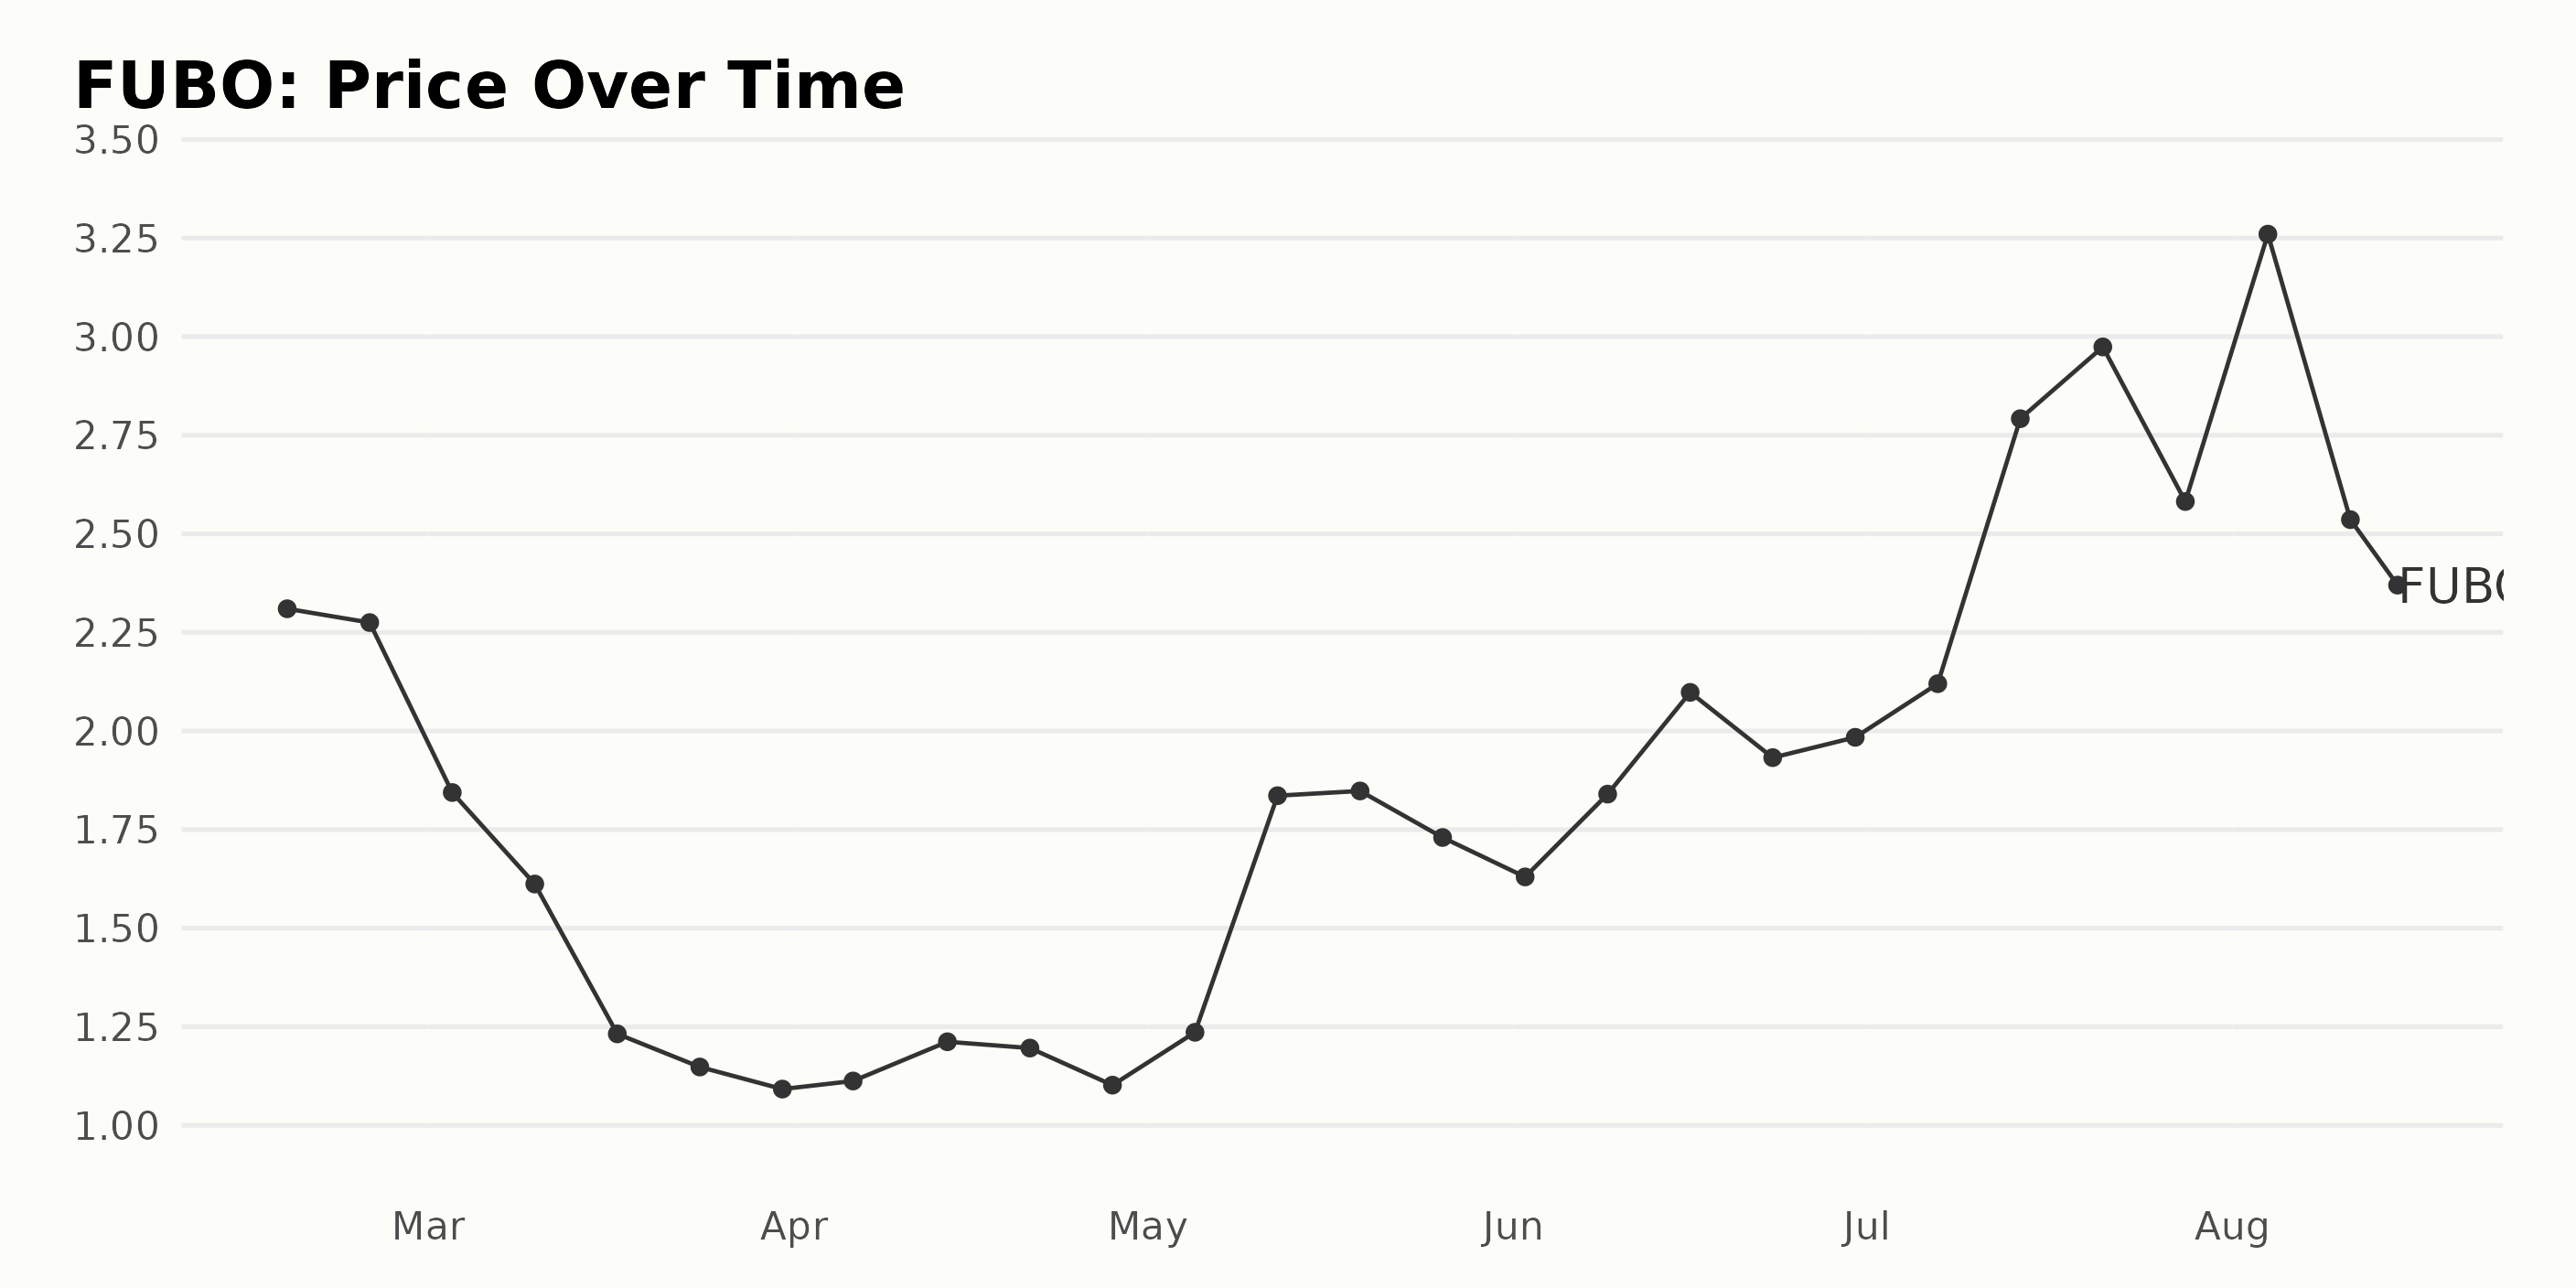
Analyzing the data provided, the following indicators of trend and growth rate for the share price of FUBO can be discerned:
- From February 17, 2023, priced at $2.31, a downward trend was observed until March 31, 2023, when the price hit its lowest at $1.09.
- In April 2023, the price moderately increased to reach $1.21 before falling again to $1.10 by the end of the month.
- The share price experienced an upward shift in May 2023, briefly touching $1.84 before reducing to $1.73 by the end of the month.
- Despite some fluctuations towards mid-June, the share price trend picked up speed, moving from $1.63 to $2.09 from June 2, 2023, to June 16, 2023.
- In July, the company experienced a significant rise in price, even reaching $2.97 but ended the month at a reduced value of $2.58.
- The highest peak of the year came about in the first week of August 2023, when the stock hit the top value of $3.26. Nevertheless, this upward trend sharply reversed, with the price plummeting to $2.33 by August 15, 2023.
Overall, it appears that the share value took a sharp decline early in the year yet saw significant increases in the later months, suggesting volatility. Notwithstanding, considering the overall trajectory from February to August 2023, FUBO marked a notable growth rate despite the evident periods of deceleration and acceleration in its share price during this timeline.
This shows that the trend does have its ups and downs, with no steady direction. Here is a chart of FUBO's price over the past 180 days.
Analyzing FUBO's POWR Ratings: Growth, Value, and Momentum Trends in 2023
Based on the data provided, the POWR Ratings grade of FUBO, a company in the Entertainment - Sports & Theme Parks category of stocks, has seen some changes over time. Here is the week-by-week breakdown:
- As of February 18, 2023, the POWR Grade was F (Strong Sell). It held the last position among the 14 stocks in its category.
- Between February 25, 2023, and March 18, 2023, the POWR Grade remained at an F (Strong Sell), and the rank within the category stayed at #14.
- Starting from March 25, 2023, there was an improvement in the POWR Grade to D (Sell). This improvement was consistent till the first week of April 2023, with the rank in the category at #13.
- In the second week of April 2023, the rank improved to #12, although the POWR Grade remained at D (Sell).
- However, from April 22, 2023, the rank fluctuated between #10, #11, #12, and #13, despite the POWR Grade consistently being D (Sell).
As of the latest available data from August 16, 2023, FUBO's POWR Grade is D (Sell), and it is ranked #11 in its category.
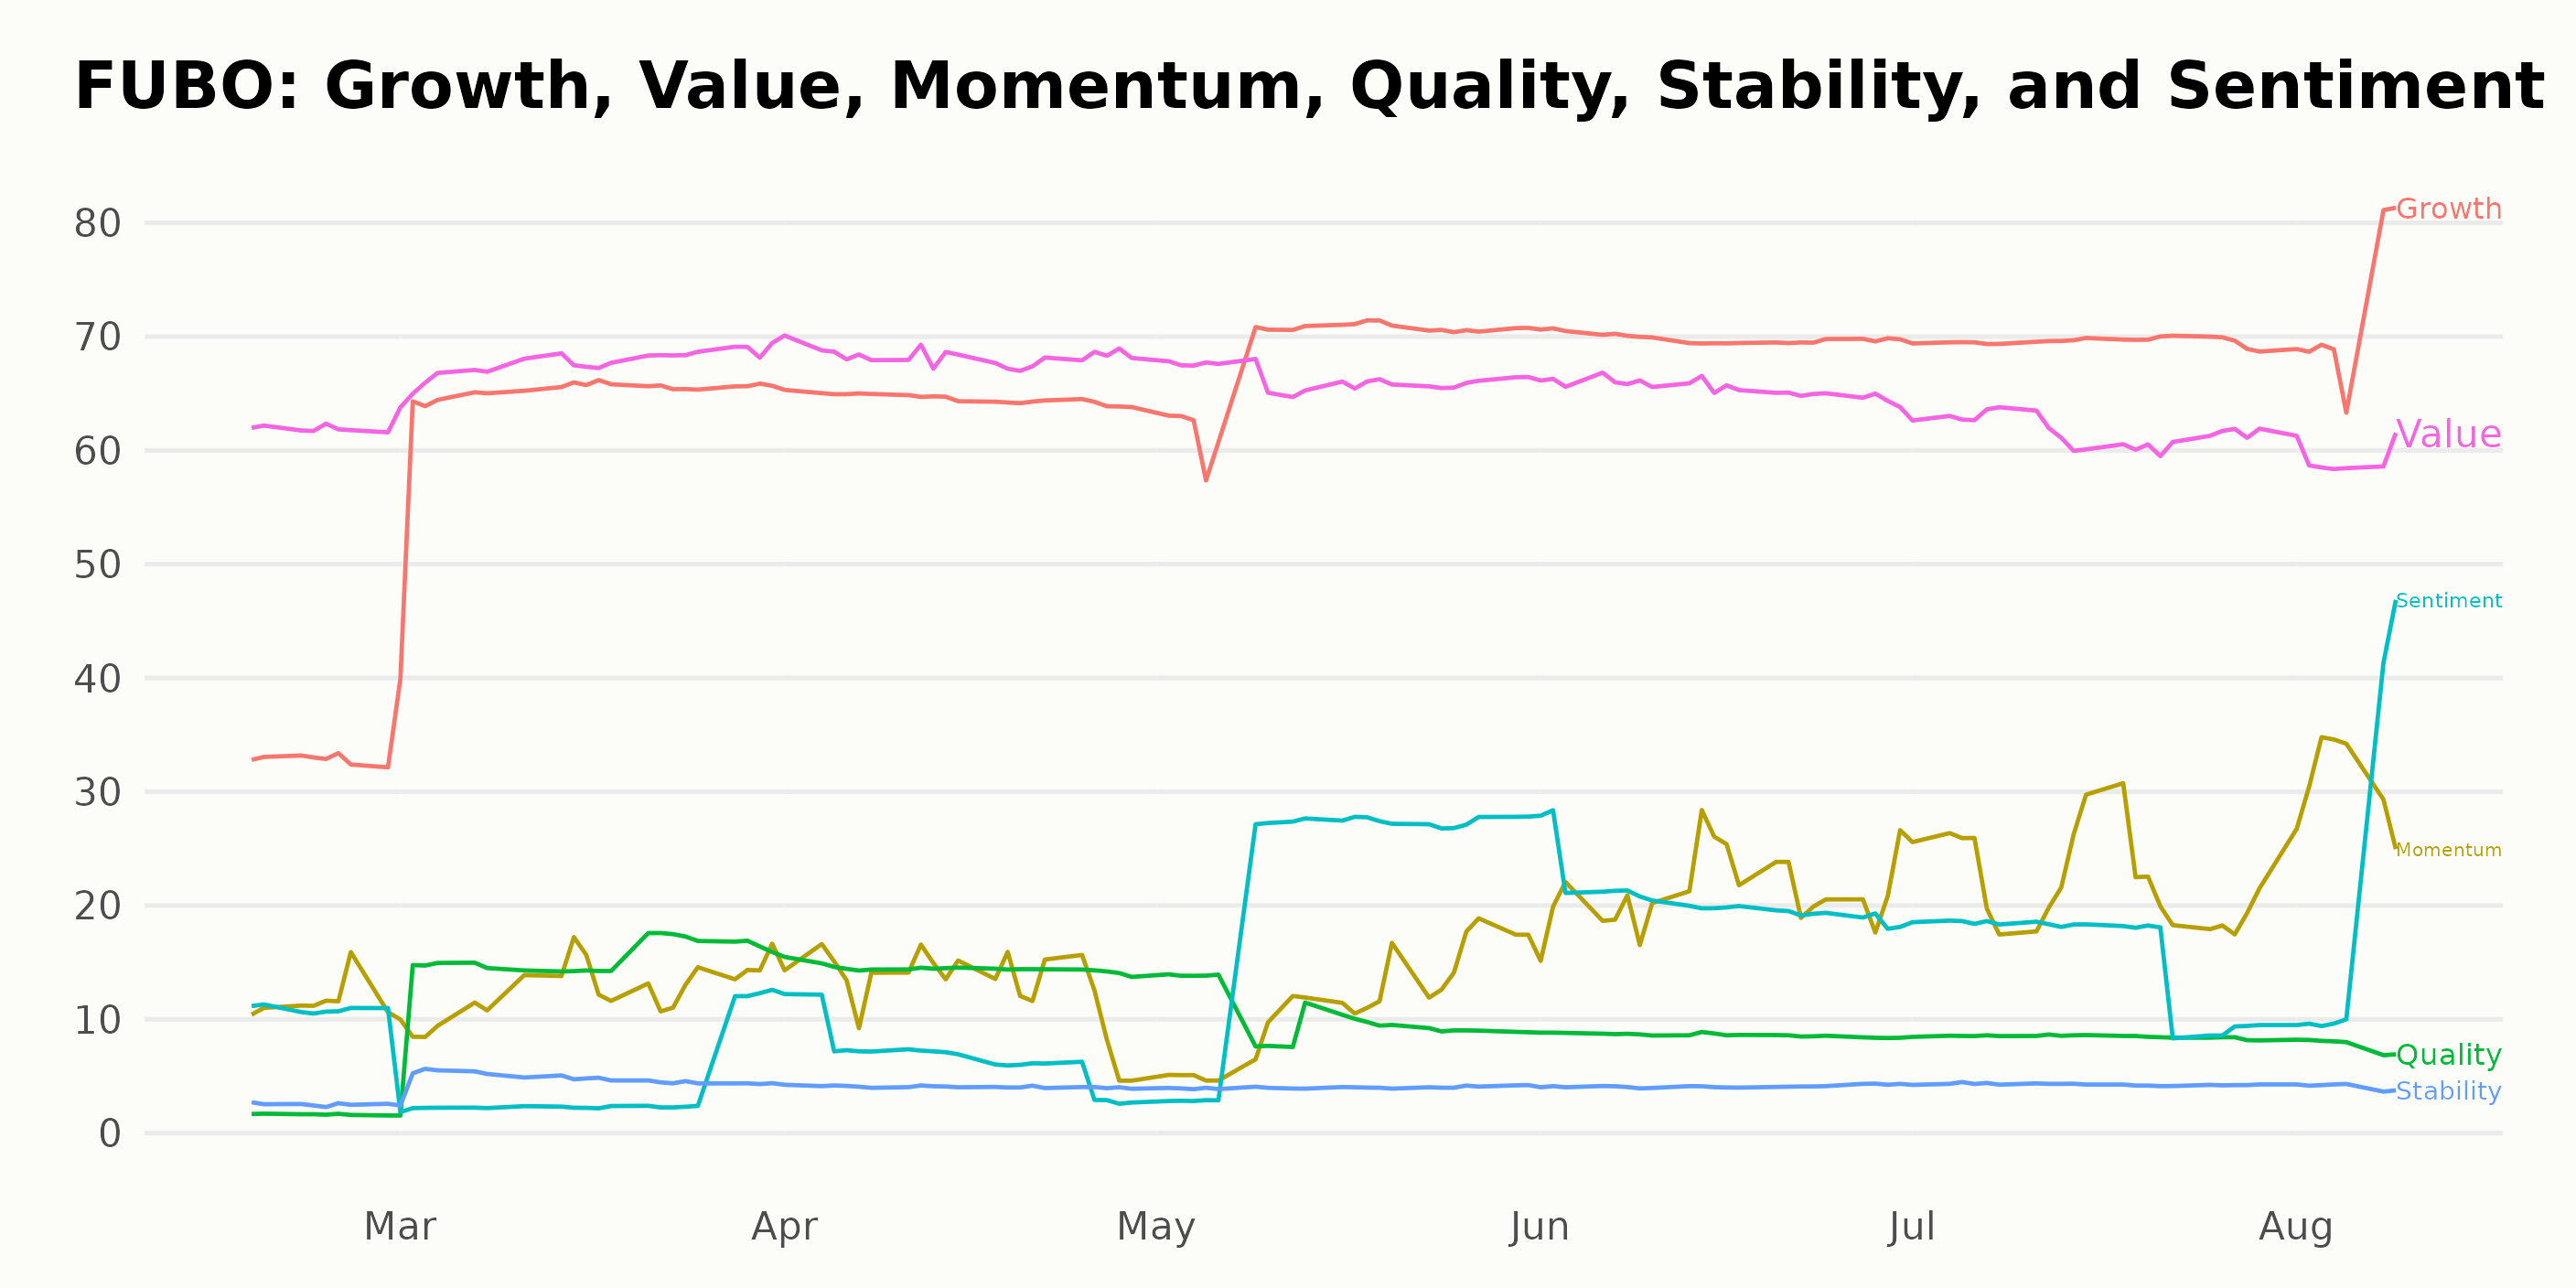
Based on the available data, the three most noteworthy dimensions of FUBO's POWR Ratings are Growth, Value, and Momentum.
Growth
- As of February 2023, the rating was at 33, but there has been a remarkable upward trend throughout August 2023. By August 9, 2023, it had risen to 72.
Value
- Value started high at 62 in February 2023. It peaked at 68 in March and April 2023 before falling gradually to 59 by August 2023.
Momentum
- Starting fairly low at 12 in February 2023, Momentum has gradually improved, culminating at 31 by August 2023.
These trends show that while Growth and Momentum have generally seen an increase across the monitored period, Value, despite experiencing an initial peak, has seen a slight decrease.
How does fuboTV Inc. (FUBO) Stack Up Against its Peers?
Other entertainment stocks that may be worth considering are Endeavor Group Holdings, Inc. (EDR), Comcast Corporation (CMCSA), and Playtika Holding Corp. (PLTK) - they have better POWR Ratings.
What To Do Next?
Discover 10 widely held stocks that our proprietary model shows have tremendous downside potential. Please make sure none of these “death trap” stocks are lurking in your portfolio:
FUBO shares were trading at $2.28 per share on Wednesday afternoon, down $0.05 (-2.15%). Year-to-date, FUBO has gained 31.03%, versus a 16.48% rise in the benchmark S&P 500 index during the same period.
About the Author: Anushka Dutta

Anushka is an analyst whose interest in understanding the impact of broader economic changes on financial markets motivated her to pursue a career in investment research.
The post Is fuboTV Inc. (FUBO) a Growth or Momentum Stock? appeared first on StockNews.com