


Chances are that if you’re running a public facing blog, you’re probably happiest when someone actually reads it. Preferably lots of someones. Your blog’s stats can give you some great ways to get to know a little bit more about your readers, and what it is about your work that most attracts them.
While the more liberal artsy types among us might shoo off the idea of obsessively stat trawling as something for the more scientifically inclined, there’s actually something for everyone lurking just beneath the surface, whether that’s inspiration or cold, hard logic. If you want people to read your blog, making use of your stats can give you an arsenal of information to help make that happen. In our Stats Wrangling series, we’ll be digging in to how to get to grips with your blog stats, one module at a time. But in today’s post, we’ll start with a whirlwind tour of the whole works.
The Fifty Mile View

The first thing you’ll want to do is to head to the Stats tab of WordPress.com, once you’ve logged in. That’s going to take you to the fifty mile view, the big picture, of what’s happening on your blog right now, in terms of the people visiting and reading it.
From up on high you can get a nice overview of what’s currently “trending”, or most of interest to the people visiting your blog. And that can give you some ideas in and of itself. But to get right down to business, you’ll want to dig into the different sections of your stats, and click through the “summary” sections, where a lot more information lurks.
Days, Weeks, & Months
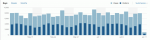
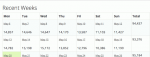
Let’s start with Days, Weeks, & Months. By default, you’ll be able to see which days have been most popular in terms of visits to your blog. Clicking through to the “Weeks”, “Months”, or “Summaries” sections give you some different ways to see how things are going on a bigger scale. As you click through those, ask yourself a couple of questions:
- Are certain days of the week more popular than others? Could it be that publishing on Mondays, for instance, is a bad idea, when every time you publish on a Friday, your stats seem to soar much higher?
- Are there certain weeks of the year when traffic either nose dives or picks up considerably? Does that correspond to your summery fruit punch recipé, or your beautiful photos of an Icelandic Santa’s Grotto? How could you create more content to chime in with these seasonal spikes, or avoid seasonal fall off by focusing your attention elsewhere?
Digging into your Top Posts and Pages gives you a very clear idea of your most popular content. Which is a great way of getting ideas as to the type of content browsers and visitors are most interested in reading. Consider:
- Where are people consistently heading when they arrive at your blog?
- Whether you’re making the best of those posts and pages, or if they could use a spring clean?
Checking out your list of referrers will give you a better idea of how people found your blog in the first place. For a lot of people, that will have been through search engines, but you’re likely to see all sorts of referrers in the mix. Ask yourself:
- Where are people coming from to find you?
- Is there anything you can do to make it even easier for those people to find you in future?

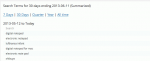
This one follows directly on from your top referrers. If people are finding your blog by searching for something, what is that they were looking for, and how does that chime in with the post they ended up finding on your blog? Ask yourself:
- What are people searching for when they stumble on your blog?
- Can you do a better job of helping them find what they’re looking for, by using clearer wording, or building on that most popular content with more posts, or even a page?
Tags, and to a degree, categories are really important, especially in the WordPress.com community, where folks might very well find and follow you in the Reader based solely on how you’ve tagged your posts. If you aren’t tagging your posts, it’s a bit like opening a restaurant at the end of a dusty dirt road and not putting up a sign to show people where it is. Looking at your Tags & Categories stats, consider:
- Are you tagging your posts consistently? And putting them into categories that make instant sense to someone browsing your site for the first time?
- Which tags and categories are consistently hot to trot? Can you write more in that category to keep people coming back for more?
How (and if) people are sharing your posts with their friends and online contacts can also be interesting in terms of seeing where you could possibly spend more of your attention. Consider:
- Where are people, if they are, sharing your work? Facebook? Twitter? Elsewhere?
- How could you make it easier for them to do that? Have you, for instance, linked your blog up to your Facebook or Twitter accounts?
If someone’s taken the time to comment on your blog, they’re well worth learning more about. Taking a look at this section of your stats, consider:
- Who comments most on your blog?
- Have you visited their blog or commented on their posts?
While we’ve been mostly interested in how people have arrived at your blog so far, it’s also worth considering how they’re leaving it. The Clicks section of your stats is useful for learning all about that. Taking a look through this section, ask yourself:
- Where are you sending people once they leave your blog?
- Do you see any relationship between your posts and the places they’re headed?

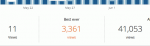
One way to create success for a post is to see what’s worked before (see: every film ever made in Hollywood). Clicking on the Best Ever link just under the main stats graph, ask yourself, as you browse the results:
- What was the best ever day for your blog?
- Looking at all of the stats we’ve discussed above, specifically for this day, what picture do you have about what made that day successful for your blog?
I hope this quick overview of your stats gives you some ideas about how you can make better use of them to make your posts even better. Remember, it’s not about changing who you are, or what you write, to serve some magical formula, but just a way to get a better handle on what’s working, and what’s not working so well, on your blog. Having an idea about what makes your readers tick, can, if you’re interested in having more of them, be really useful when you’re next thinking up a blog post. Stats shouldn’t be restrictive or prescriptive, but rather another source of inspiration for where to take your blog next.
How have your stats made a difference to your blogging?
Image based on “Madrid-Stock market, Spain (2012) by Alberto Carrasco Casado, CC-BY-2.0.

