
Insurance data analytics provider Verisk Analytics (NASDAQ: VRSK) met Wall Street’s revenue expectations in Q2 CY2025, with sales up 7.8% year on year to $772.6 million. The company’s full-year revenue guidance of $3.11 billion at the midpoint came in 1% above analysts’ estimates. Its non-GAAP profit of $1.88 per share was 6.1% above analysts’ consensus estimates.
Is now the time to buy Verisk? Find out by accessing our full research report, it’s free.
Verisk (VRSK) Q2 CY2025 Highlights:
- Revenue: $772.6 million vs analyst estimates of $769.4 million (7.8% year-on-year growth, in line)
- Adjusted EPS: $1.88 vs analyst estimates of $1.77 (6.1% beat)
- Adjusted EBITDA: $445 million vs analyst estimates of $430.5 million (57.6% margin, 3.4% beat)
- The company lifted its revenue guidance for the full year to $3.11 billion at the midpoint from $3.06 billion, a 1.8% increase
- Management lowered its full-year Adjusted EPS guidance to $6.90 at the midpoint, a 0.7% decrease
- EBITDA guidance for the full year is $1.72 billion at the midpoint, in line with analyst expectations
- Operating Margin: 45.9%, up from 44.5% in the same quarter last year
- Free Cash Flow Margin: 24.4%, up from 21.5% in the same quarter last year
- Constant Currency Revenue rose 7.9% year on year (6% in the same quarter last year)
- Market Capitalization: $41.13 billion
Company Overview
Processing over 2.8 billion insurance transaction records annually through one of the world's largest private databases, Verisk Analytics (NASDAQ: VRSK) provides data, analytics, and technology solutions that help insurance companies assess risk, detect fraud, and make better business decisions.
Revenue Growth
A company’s long-term sales performance can indicate its overall quality. Any business can put up a good quarter or two, but many enduring ones grow for years.
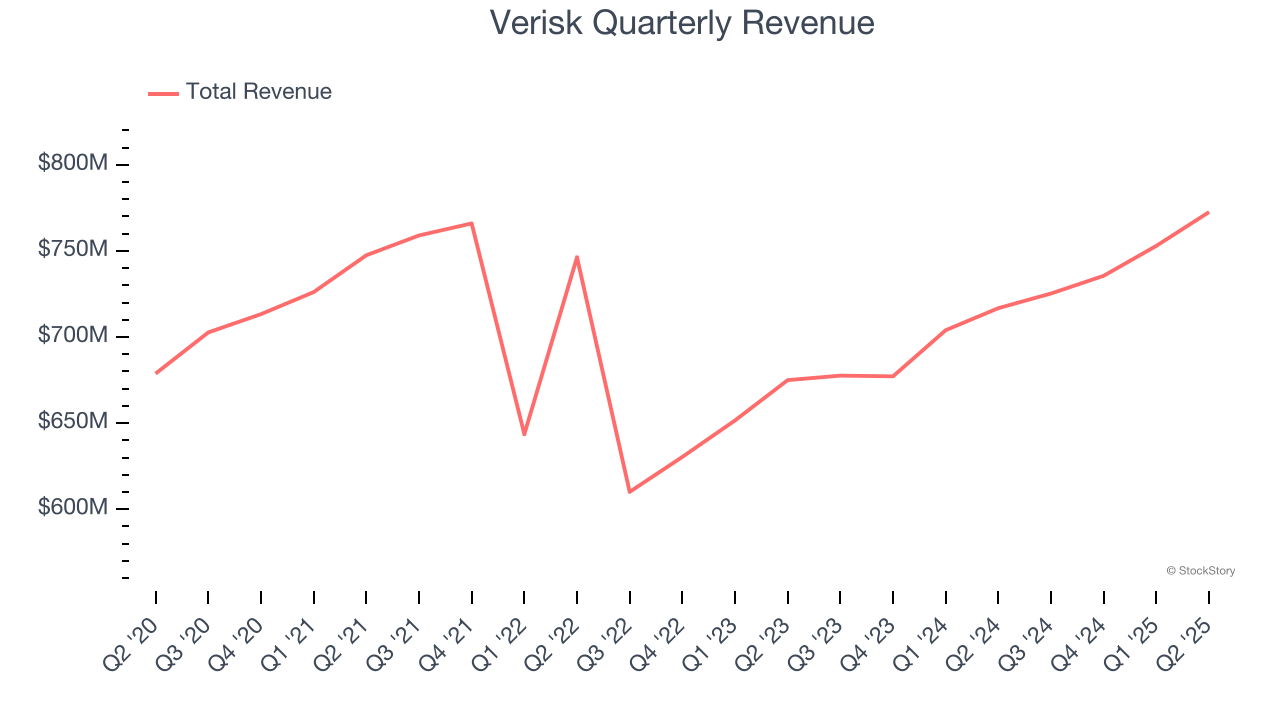
With $2.99 billion in revenue over the past 12 months, Verisk is a mid-sized business services company, which sometimes brings disadvantages compared to larger competitors benefiting from better economies of scale.
As you can see below, Verisk grew its sales at a sluggish 2.1% compounded annual growth rate over the last five years. This shows it failed to generate demand in any major way and is a rough starting point for our analysis.
We at StockStory place the most emphasis on long-term growth, but within business services, a half-decade historical view may miss recent innovations or disruptive industry trends. Verisk’s annualized revenue growth of 7.9% over the last two years is above its five-year trend, suggesting its demand recently accelerated. 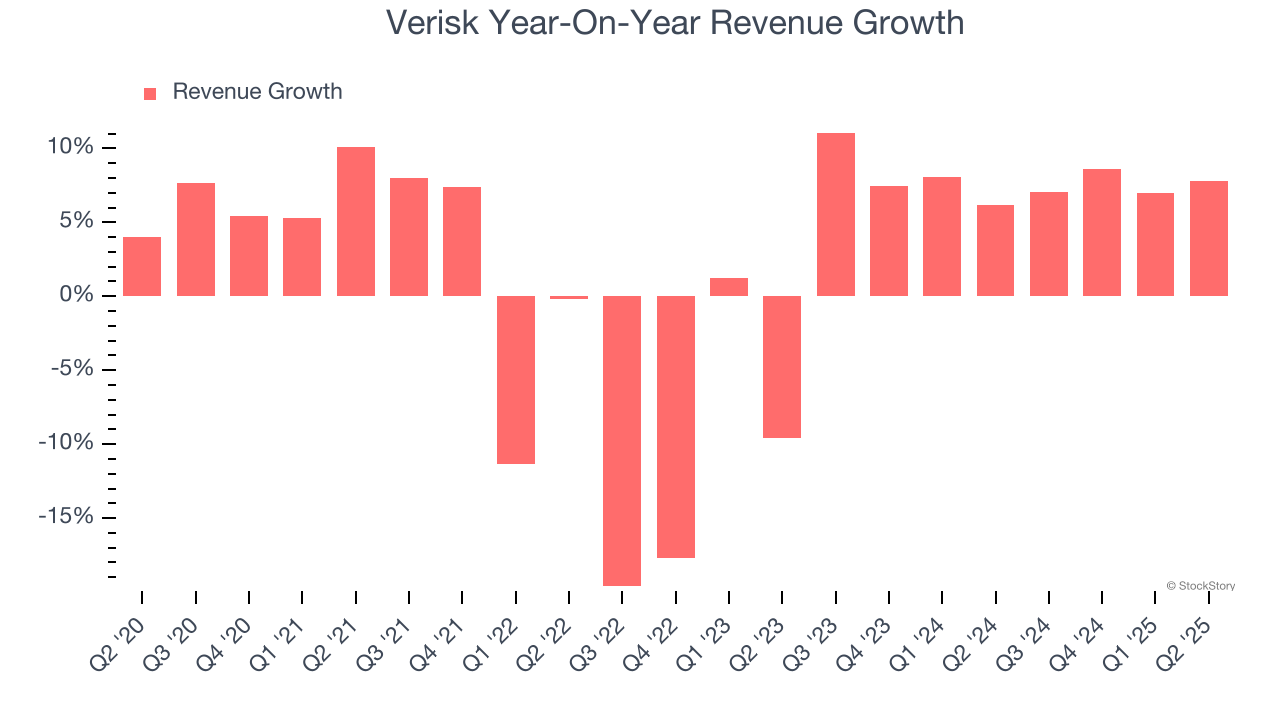
Verisk also reports sales performance excluding currency movements, which are outside the company’s control and not indicative of demand. Over the last two years, its constant currency sales averaged 7.4% year-on-year growth. Because this number aligns with its normal revenue growth, we can see that Verisk has properly hedged its foreign currency exposure. 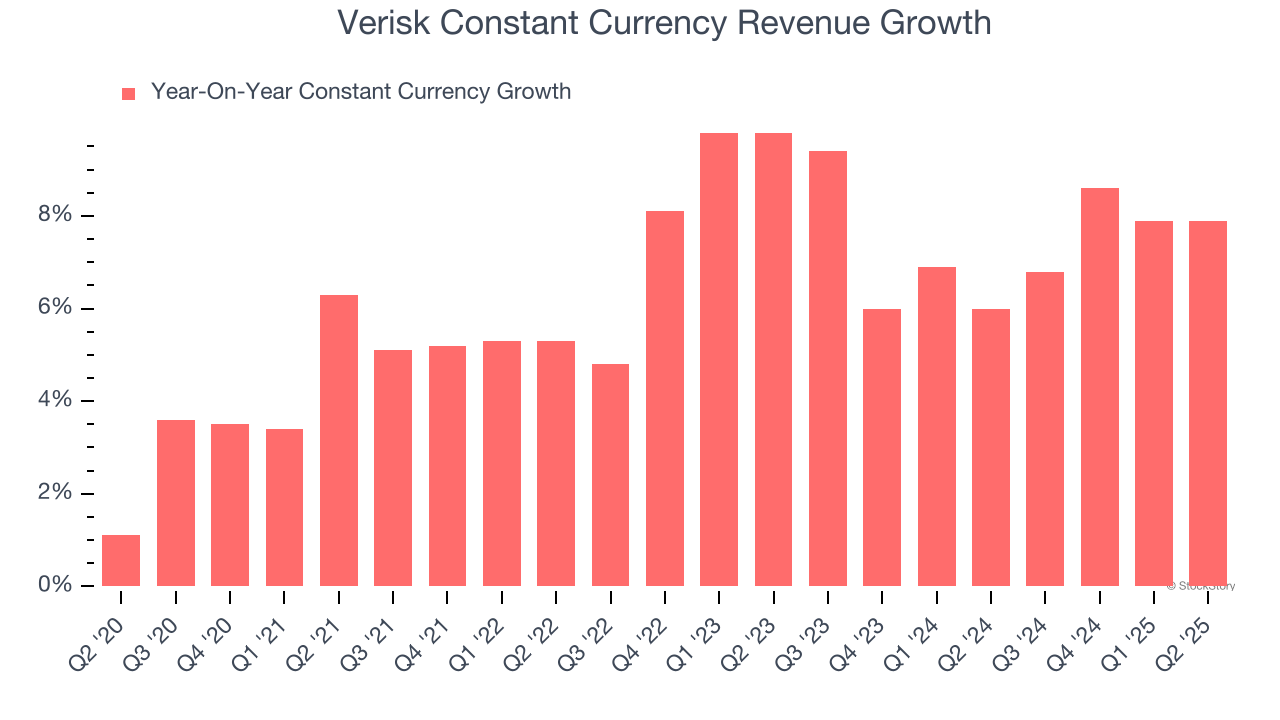
This quarter, Verisk grew its revenue by 7.8% year on year, and its $772.6 million of revenue was in line with Wall Street’s estimates.
Looking ahead, sell-side analysts expect revenue to grow 6.8% over the next 12 months, similar to its two-year rate. Still, this projection is above the sector average and indicates the market is forecasting some success for its newer products and services.
Today’s young investors won’t have read the timeless lessons in Gorilla Game: Picking Winners In High Technology because it was written more than 20 years ago when Microsoft and Apple were first establishing their supremacy. But if we apply the same principles, then enterprise software stocks leveraging their own generative AI capabilities may well be the Gorillas of the future. So, in that spirit, we are excited to present our Special Free Report on a profitable, fast-growing enterprise software stock that is already riding the automation wave and looking to catch the generative AI next.
Operating Margin
Operating margin is an important measure of profitability as it shows the portion of revenue left after accounting for all core expenses – everything from the cost of goods sold to advertising and wages. It’s also useful for comparing profitability across companies with different levels of debt and tax rates because it excludes interest and taxes.
Verisk has been a well-oiled machine over the last five years. It demonstrated elite profitability for a business services business, boasting an average operating margin of 42.9%.
Looking at the trend in its profitability, Verisk’s operating margin rose by 7.8 percentage points over the last five years, as its sales growth gave it operating leverage.
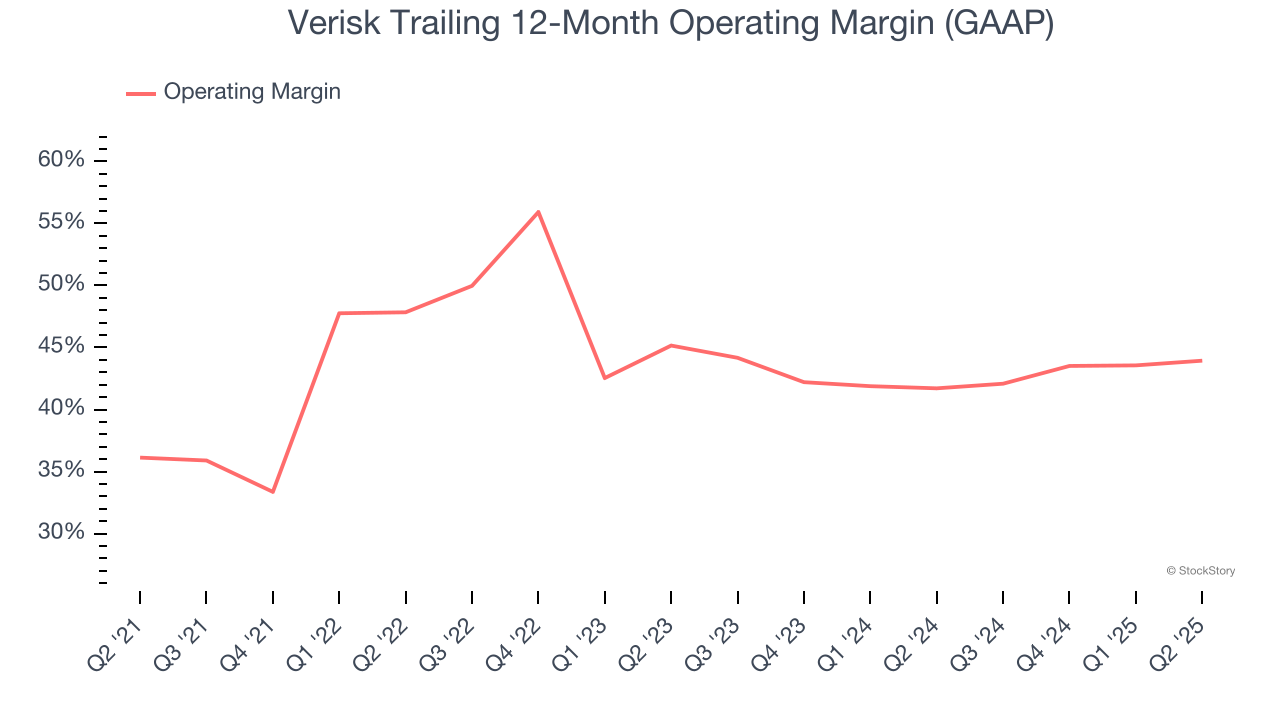
In Q2, Verisk generated an operating margin profit margin of 45.9%, up 1.4 percentage points year on year. This increase was a welcome development and shows it was more efficient.
Earnings Per Share
Revenue trends explain a company’s historical growth, but the long-term change in earnings per share (EPS) points to the profitability of that growth – for example, a company could inflate its sales through excessive spending on advertising and promotions.
Verisk’s EPS grew at a decent 7.9% compounded annual growth rate over the last five years, higher than its 2.1% annualized revenue growth. This tells us the company became more profitable on a per-share basis as it expanded.
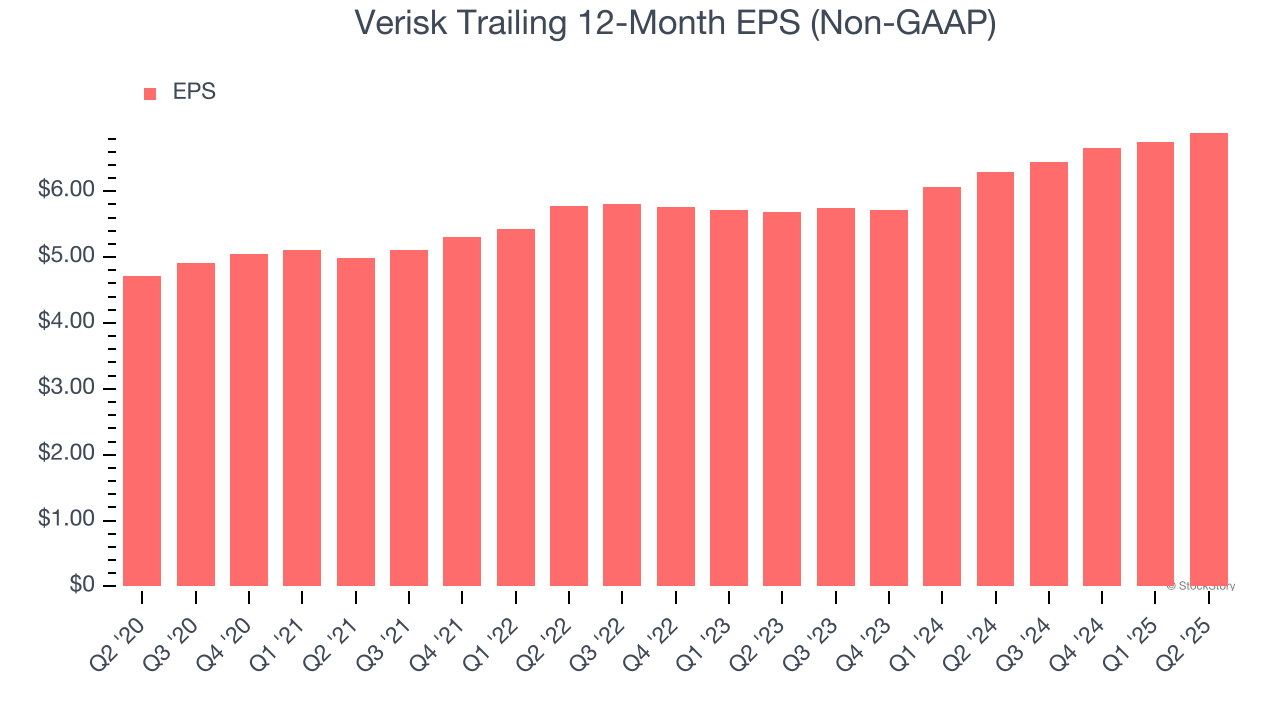
We can take a deeper look into Verisk’s earnings to better understand the drivers of its performance. As we mentioned earlier, Verisk’s operating margin expanded by 7.8 percentage points over the last five years. On top of that, its share count shrank by 15%. These are positive signs for shareholders because improving profitability and share buybacks turbocharge EPS growth relative to revenue growth. 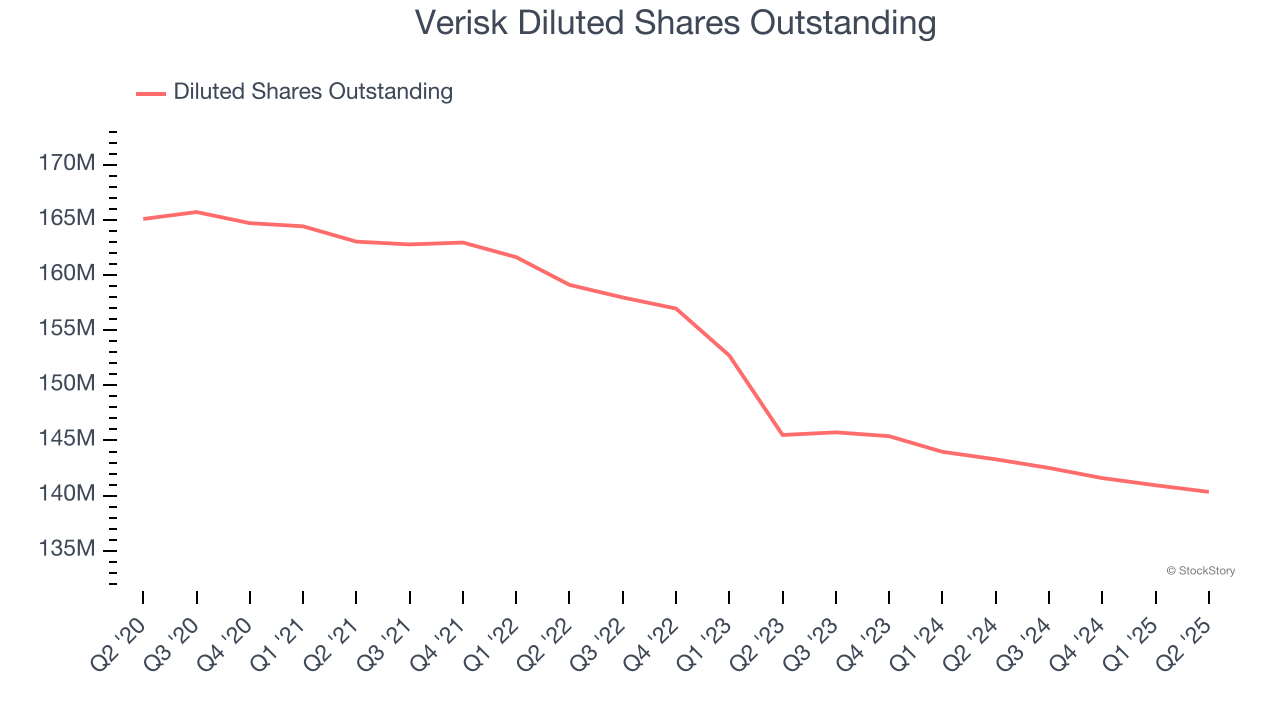
Like with revenue, we analyze EPS over a more recent period because it can provide insight into an emerging theme or development for the business.
For Verisk, its two-year annual EPS growth of 10% was higher than its five-year trend. Accelerating earnings growth is almost always an encouraging data point.
In Q2, Verisk reported EPS at $1.88, up from $1.74 in the same quarter last year. This print beat analysts’ estimates by 6.1%. Over the next 12 months, Wall Street expects Verisk’s full-year EPS of $6.89 to grow 7.8%.
Key Takeaways from Verisk’s Q2 Results
It was encouraging to see Verisk beat analysts’ EPS and EBITDA expectations this quarter. We were also glad its full-year revenue guidance slightly exceeded Wall Street’s estimates. On the other hand, its full-year EPS guidance missed. Overall, this was a decent quarter. The stock traded up 2% to $300 immediately after reporting.
So do we think Verisk is an attractive buy at the current price? When making that decision, it’s important to consider its valuation, business qualities, as well as what has happened in the latest quarter. We cover that in our actionable full research report which you can read here, it’s free.